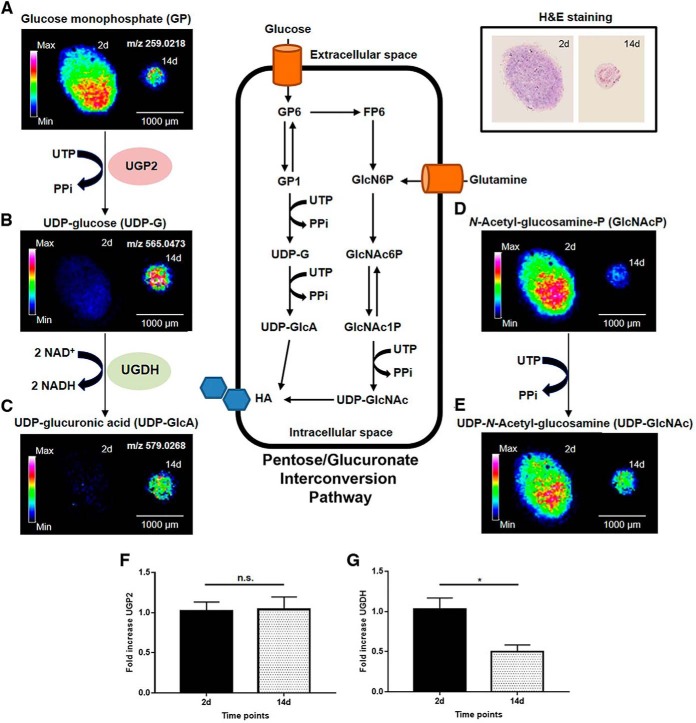
Fig. 5.
Spatial distribution and metabolic changes involved in the UDP-glucuronic acid interconversion pathway and amino sugar metabolism in OA hBMSCs. A–E, MALDI-MSI images showing the abundance and spatial distribution of glucose monophosphate (A), UDP-glucose (B), UDP-glucuronic acid (C), N-Acetyl-glucosamine-phosphate (D) and UDP-N-Acetyl-glucosamine (E) in OA micromasses at days 2 (left) and 14 (right) of chondrogenesis. F, G, Gene expression levels determined by qRT-PCR of UTP-glucose-1-phosphate uridylyltransferase (F) and UDP-glucose 6-dehydrogenase (G). In (A-E), data were normalized by root means square. In (F–G), data are expressed as mean ± SEM of 5 independent experiments. * p value < 0.05, n.s. not significant.

