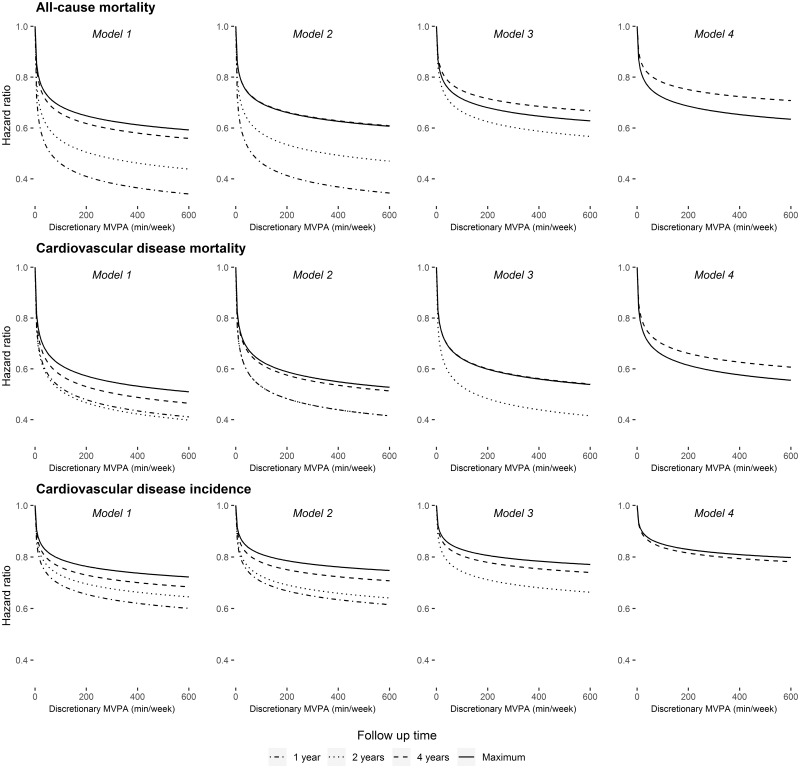
Figure 2.
Dose–response relationships between physical activity and health outcomes at 1, 2, 4 and 7 years of follow-up (6.1 years for CVD incidence) using four modelling approaches in the UK Biobank study (2006–2010 to 2015–2016). All analyses were adjusted for covariates listed in the text. Model 1: also adjusted for prevalent disease (CVD and cancer); Model 2: excluded those with prevalent disease; Model 3: Model 2 + excluded cases occurring in first year of follow-up; Model 4: Model 2 + excluded cases occurring in first 2 years of follow-up.

