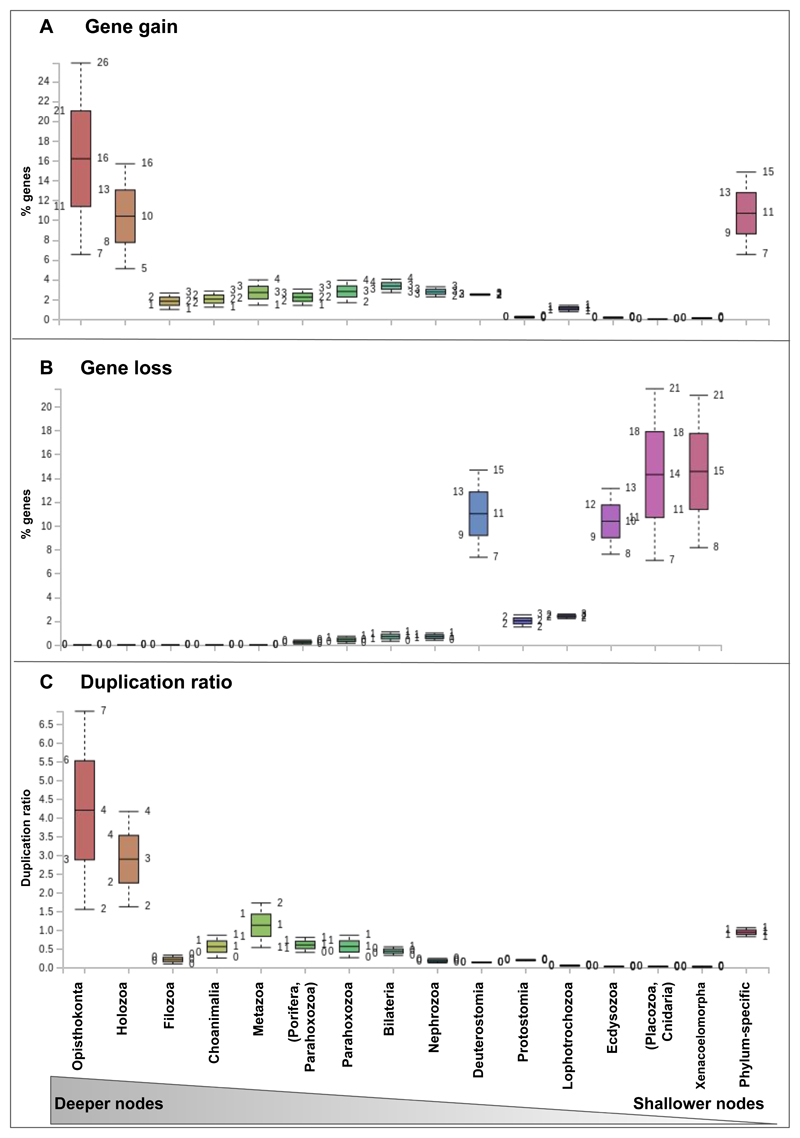
Figure 2. Gene gain and duplication ratios are high at deeper nodes, and gene loss at shallower ones.
Box plot graphs of gene gain (a), loss (b) and duplication ratios (c) per node as inferred from dataset 1. Mean and standard deviation values are shown for each node. Colors indicatenodes as shown in the legend.

