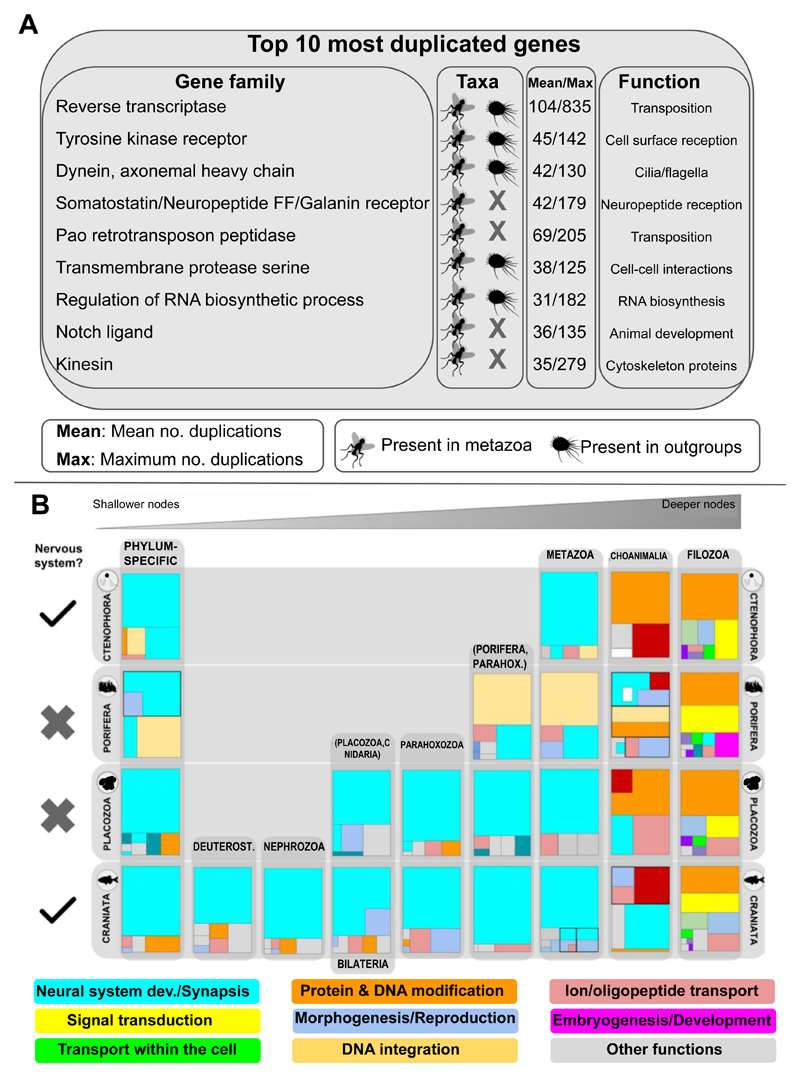
Figure 3. Genes related to the neural system are amongst the most highly duplicated.
a. List of top 10 most duplicated gene families as defined by OrthoFinder2. Group of taxa in which these families were inferred (metazoa or outgroups), mean and maximum number of duplications across animals and putative functions are indicated. b. Treemap representation of GO enrichment analysis of duplicated genes related to neural system (light blue) in all nodes in Ctenophora, Porifera, Placozoa and Craniata (see also Suppl. Mat.). Other colors represent other functions as shown in the legend. Each main square represents hierarchical GO term relationships. Square size is proportional to the p value for each GO term as found in the enrichment analyses. Scales are irrelevant.

