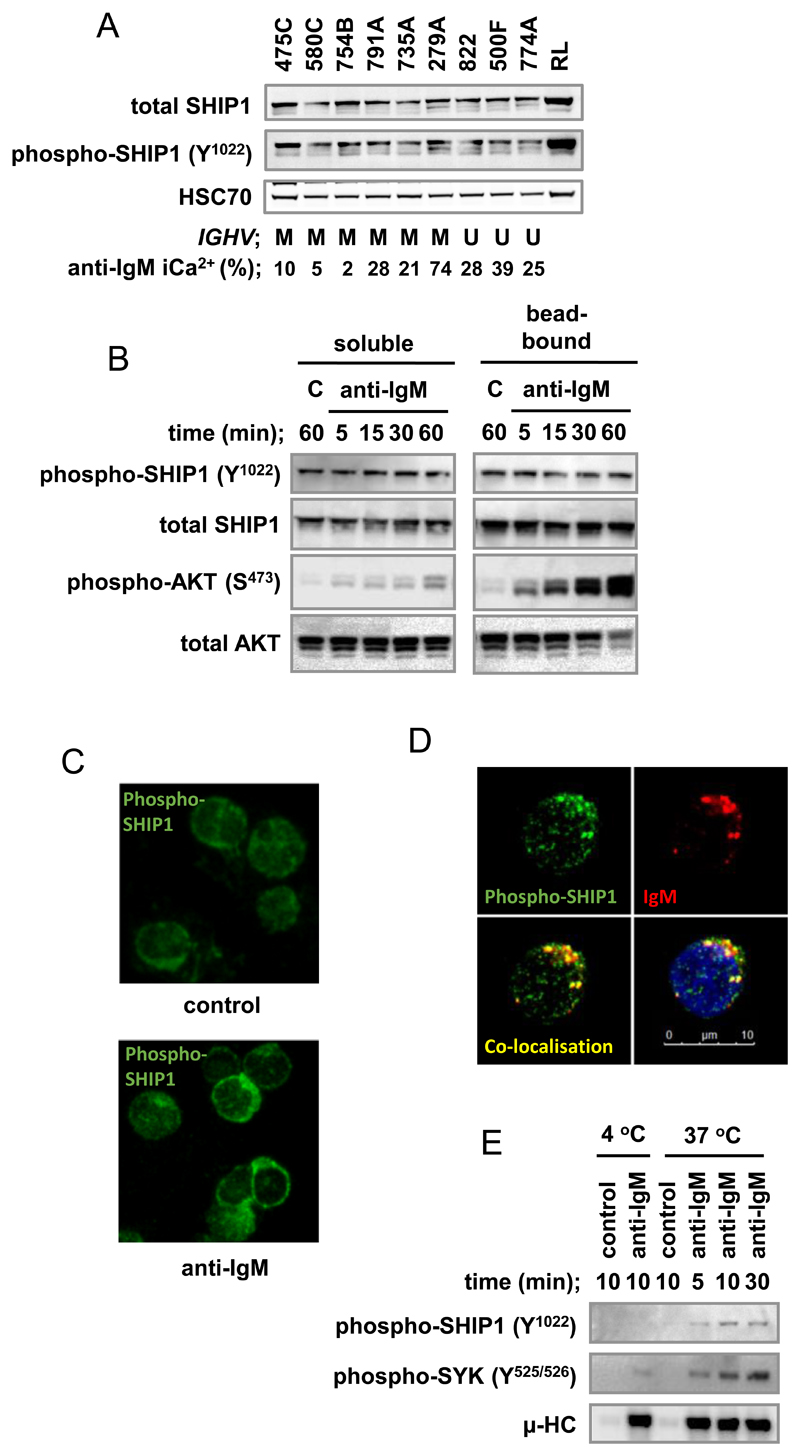
Figure 1.
Characterization of SHIP1 in primary CLL samples. A, Lysates were prepared from CLL samples or RL cells (positive control), and expression of total and phospho-SHIP1, and HSC70 (loading control) was analyzed using immunoblotting. Figure shows results for 9 representative samples from a total of 41 (total SHIP1) or 29 (phospho-SHIP1) samples analyzed with IGHV mutation status (M, mutated; U, unmutated) and anti-IgM signaling capacity (iCa2+, percent responding cells; Ref. (33) indicated. B, CLL samples were treated with soluble or bead-bound anti-IgM or control (C) antibodies for the indicated times. Expression of total and phospho-SHIP1 and total and phospho-AKT (S473) was analyzed by immunoblotting. Fig. shows results for 1 representative sample from a total of 8 samples analyzed. C and D, CLL samples were treated with soluble anti-IgM at 37 °C for 30 minutes, or left untreated as a control. Fixed cells were stained with anti-phospho-SHIP1 and then secondary antibodies to detect bound anti-phospho-SHIP1 or anti-IgM. C, Phospho-SHIP1 expression (±anti-IgM) in a representative sample of 7 samples analyzed. D, Confocal microscopy of anti-IgM-treated cells; anti-phospho-SHIP1 (green), anti-IgM (red) and/or DAPI stained (blue) anti-IgM-treated cells. In merged images (bottom row), co-localization of anti-phospho-SHIP1 and anti-IgM staining is shown in yellow, with or without DAPI staining. Image shown is representative of 5 samples analyzed. E, CLL samples were incubated with bead-bound anti-IgM or control antibody at 4 °C or 37 °C for the indicated times. Beads were collected by centrifugation and bound heavy-chain (μ-HC), phospho-SHIP1 and phospho-SYK were analyzed by immunoblotting. Results shown are representative of 2 samples analyzed.

