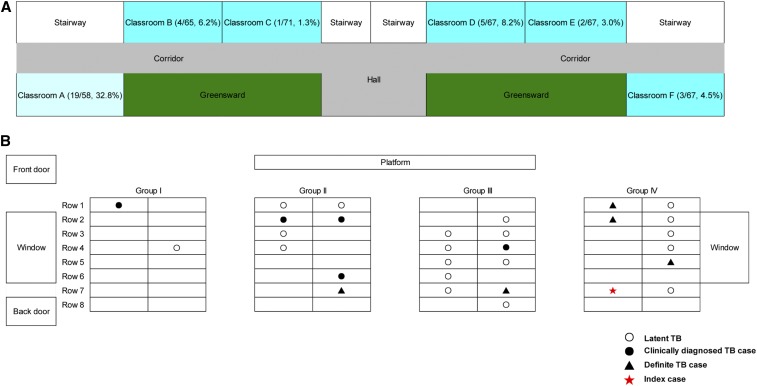
Figure 1.
Distribution of active tuberculosis (TB) cases and TB infections in this investigation. (A) Floor plan of classrooms at high school in Yunnan. Values are number of TB infections/total number of students tested in classroom. Shading indicates classroom is that of index case. (B) Distribution of active TB cases and TB infections in the classroom where the index case lived.

