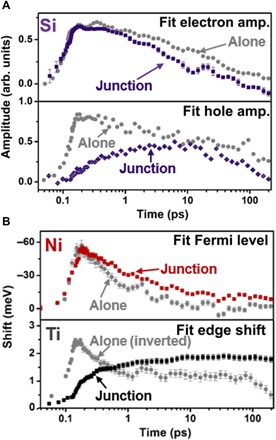
Fig. 3. Comparing the fit kinetics separately and in a junction.

The spectral signatures described by Fig. 2 are fit to extract the excited-state kinetics, shown here. In each case, the error bars correspond to the nonlinear fit standard error from a robust fit weighted by the experimental uncertainty. For each plot, the junction fit parameters are shown as the colored symbols, while the gray symbols are for the isolated material. The time scale is logarithmic with a 100-fs offset for visualization. (A) The amplitude of electron spectral signature in the junction (purple symbols) has a similar rise time compared to the isolated material but has an increased decay rate. In the isolated Si, the amplitude of the hole spectral feature (gray symbols in bottom panel) follows the same kinetics as the electrons. In the junction, the hole signature slowly grows until 10 ps, suggesting that the initial photoexcited hole population was transferred out from the Si. (B) Top: The fit Fermi level of Ni decreases when the Si in the junction is excited with 800-nm light or when a 20× thicker Ni film alone is excited with 800-nm light. The fit Fermi level then decays on a longer time scale in the junction. The amplitudes are scaled for comparison of the rise times. Bottom: When TiO2 alone is excited with 266-nm light, a decrease in the fitted edge energy is observed because of the ligand-to-metal charge transfer. In the junction, the Ti edge fit energy increases on a time scale that matches the decay of the Fermi level in Ni.
