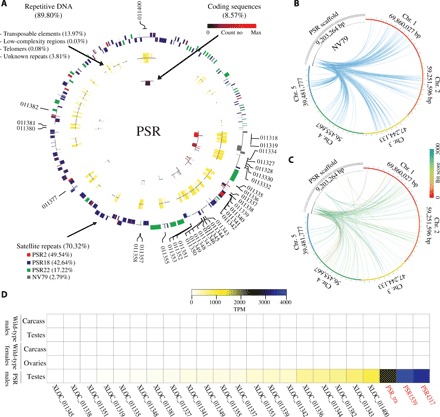
Fig. 1. Composition and origin of PSR chromosome.

(A) Circular portrayal of the PSR chromosome scaffolds. The scaffolds are organized from largest to smallest (their natural order with respect to each other could not be determined with current data). The outermost track represents repetitive satellites with outer bars representing the positive DNA strand, and the inner bars represent the negative DNA strand. The colors represent the four major (70.32%) satellite families. The middle track represents other repetitive sequences (17.89%) including TEs, low-complexity regions, and telomeric sequences. The innermost track represents protein coding sequences (8.57%), and the color ranges from black to red for low to high expression, respectively. (B) The relationship of NV79 repeats between PSR scaffolds and host chromosomes 1 to 5, indicating that PSR repeats are homologous to sequences found on all chromosomes. (C) The relationship of PSR protein scaffolds sequences and host chromosomes. The links are colored by blast bit scores from red (highest) to blue (lowest). (D) Heat map of PSR gene with expression values higher than 10 TPM (table S8, columns M to Q). Expression levels are portrayed in colors ranging from white (low to no expression) to blue (highest expression). PSR genes that were disrupted with RNAi in this study are shown in red.
