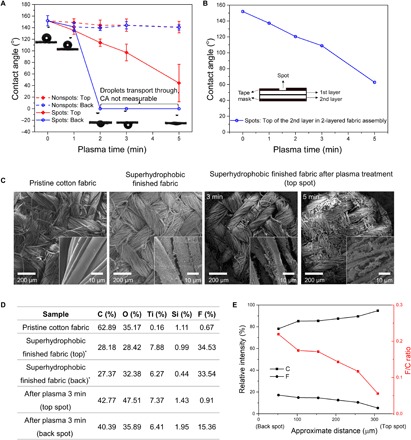
Fig. 2. Wetting behavior, microstructure, and chemical analysis of the superhydrophobic finished fabric after selective plasma treatment.

(A) CAs of the spot and nonspot areas of both top and back sides of the superhydrophobic finished fabric after plasma treatment for 0 to 5 min; insets are droplet images when dripped on the back spot areas. (B) CA of a two-layer fabric assembly to prove the wettability gradient. (C) SEM morphologies of pristine cotton fabric, superhydrophobic finished fabric, and exposed top spot areas of the superhydrophobic finished fabric after selective plasma treatment for 3 and 5 min. (D) Table of atomic contents of C, O, Ti, Si, and F on different fabric surfaces from XPS survey results. *One side of the superhydrophobic finished fabric is marked as top side, and the other is marked as back side. (E) C and F relative intensities and F/C ratios across the thickness of treated fabric (from the back spot area to the top spot area) from iXPS test.
