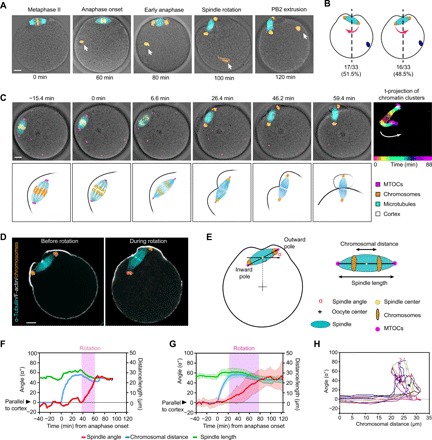
Fig. 1. MII spindle rotates in random direction relative to the sperm entry site at the end of anaphase.

(A) The stages of MII completion after fertilization. Oocytes were fixed at different time points before (metaphase II) and after fertilization and immunostained for microtubules (α-tubulin) together with chromosomes (Hoechst). White arrows indicate the sperm chromatin. (B) Percentage of eggs that rotate in the opposite direction (left) or same direction (right) with respect to the position of sperm entrance. Position of the sperm chromatin is shown as the blue dot. Red arrows indicate the rotation direction. The quantification shows that the direction of spindle rotation is not biased to the site of sperm entry (P > 0.99, indicating no significant deviation from 50%, Fisher’s exact test). (C) Montage from time-lapse imaging of an oocyte expressing fluorescent markers: mCherry-MAP4 for microtubules (cyan), enhanced green fluorescent protein (EGFP)–CDK5RAP2 for microtubule-organizing centers (MTOCs) (magenta), and Hoechst for DNA (orange), merged with differential interference contrast (DIC) images of the oocyte. The panel on the far right shows time projection (t-projection) of sequential locations of the chromosomes that are colored as indicated in the color bar at the bottom to indicate the trajectories of two clusters of sister chromosomes during anaphase and spindle rotation. White arrow indicates the direction of spindle rotation. Time 0 corresponds to anaphase onset. The bottom row illustrates the sequence of events including chromosome segregation, spindle rotation, and polar body extrusion. (D) Immunofluorescence staining of F-actin (phalloidin), spindle (α-tubulin), and chromosomes (Hoechst) in oocytes before and during spindle rotation. (E) Schematics of parameters quantifying the spindle angle, length, and distance between chromatin clusters. (F and G) Spindle orientation, length, and the distance between chromatin clusters over time for (F) a single oocyte and (G) averaged for 21 oocytes (means ± SD) are shown. (H) Twelve example traces of spindle orientation (angle, y axis) as a function the distance of chromosome segregation (x axis). Scale bars, 10 μm (for all images).
