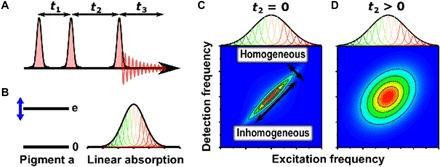
Fig. 2. What is a 2D spectrum?

(A) In 2DES (14), a sequence of three laser pulses interacts with the sample, causing emission of a signal that is recorded as a function of the three time delays. For a given “population time” t2, the Fourier transform of the signal with respect to the t1 and t3 delays provides the respective excitation and detection frequency axes of the 2D spectrum. (B) Simple quantum two-level model for the energy levels of a photosynthetic pigment, giving rise to an inhomogeneously broadened absorption spectrum. In photosynthetic complexes, the protein environment tunes the electronic energy gap, and small conformational differences among proteins probed in an ensemble measurement cause shifts of energy gaps, broadening the absorption from its inherent homogeneous width. (C) A 2D spectrum recorded at t2 = 0 separates homogeneous and inhomogeneous broadening, which are manifest as the antidiagonal and diagonal widths, respectively. (D) At later times (t2 > 0), dynamical interactions between the pigment and protein environment lead to energy gap fluctuations that broaden the antidiagonal width in a process termed spectral diffusion. The 2D spectrum contains both absorptive and refractive responses of the system; however, usually only the real part of the 2D spectrum is presented, corresponding to the absorptive part.
