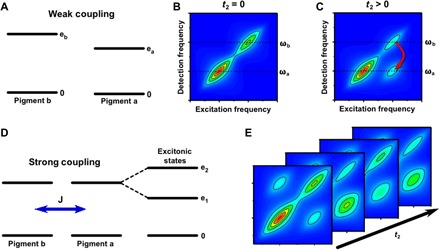
Fig. 3. What can we learn from 2D spectra?

2D spectra have rich information about electronic structure and dynamics (14). Photosynthetic complexes contain light-absorbing pigments that are held in place by a protein scaffold that controls their relative distance and orientation, determining their coupling. In (A), we consider a common case of two weakly coupled pigments a and b. (B) At t2 = 0, the 2D spectrum displays peaks along the diagonal that reveal the inhomogeneously broadened peaks at ωa and ωb, corresponding to absorption by pigments a and b, respectively. (C) At later times, if pigments a and b are sufficiently close in space and favorably oriented, then energy transfer may occur between them, with higher probability that energy flows “downhill” from the higher energy state of pigment b to pigment a. The energy transfer process leads to the formation of a cross-peak in the 2D spectrum. Recording 2D spectra as a function of population time t2 enables the mapping of energy transfer pathways and time scales. In (D), we consider the case of two strongly coupled photosynthetic pigments. The strong coupling mixes the energy levels of the individual pigments, leading to excitons in which excitations are delocalized across the coupled pigments. Excitonic coupling between transitions is revealed by cross-peaks in the t2 = 0, so-called correlation spectrum. Besides the population relaxation between two excitonic states, observed as growing of the lower cross peak, coherence is manifest as t2-dependent oscillations as shown in (E). The distribution of the oscillating signals on 2D maps can provide important insight into the physical origin of the coherence as discussed in Fig. 4.
