
Figure 2.
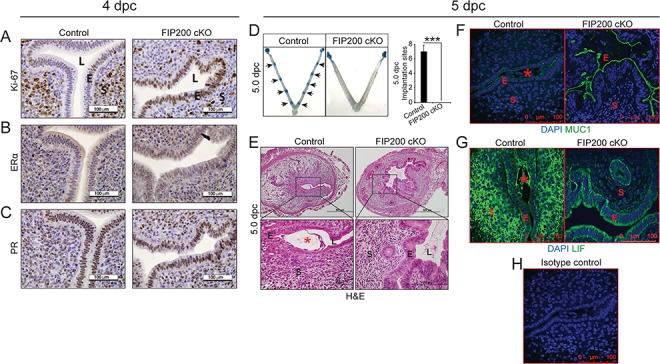
Loss of FIP200 in the mouse reproductive tract compromises embryo implantation and uterine receptivity. (A–C) Representative images of immunostaining for Ki-67 (A), ERα (B), and PR (C) of control and FIP200 cKO uteri at 4 dpc (n = 5, 4). (D) Embryo implantation sites at 5 dpc in control and FIP200 cKO mice. Black arrow denotes implantation sites. Quantitation of the number of implantation sites at 5 dpc as visualized by Chicago blue dye injection. (E-G) Representative cross-section images of the uterus at dpc 5 Control and FIP200 cKO mice stained for Hematoxylin and Eosin (E), MUC1 (F), LIF (G) and Isotype control (H) (n = 5,3). E indicates epithelium, S indicates stroma, L indicates the uterine lumen and asterisk indicates the embryo. ***P < 0.001 (Two-tailed paired student’s t-test).