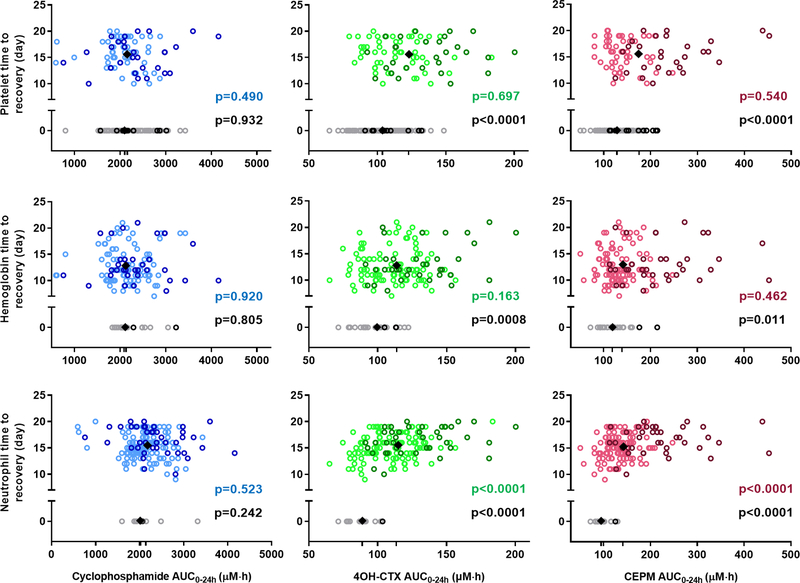
Figure 3.
Time to recovery (TR) for neutrophil counts, platelet counts, and hemoglobin concentrations association with 4OH-CTX or CEPM exposure. Each dot represents an individual value. The first, second, and third rows depict the platelet, hemoglobin, and neutrophil time to recovery values, respectively, in association with cyclophosphamide, 4OH-CTX, or CEPM exposure. Black diamonds represent the mean drug exposure values for the two groups of patients with either TR = 0 or TR > 0. Black P values denote the statistical comparison of the drug exposure distribution between these two groups of patients (Wilcoxon–Mann-Whitney test). Color P values denote the Spearman correlation between the drug exposures and the TR > 0. Dark color dots represent data from infant patients (< 1 year), and light color dots are data from other children (1 to 5 years).

