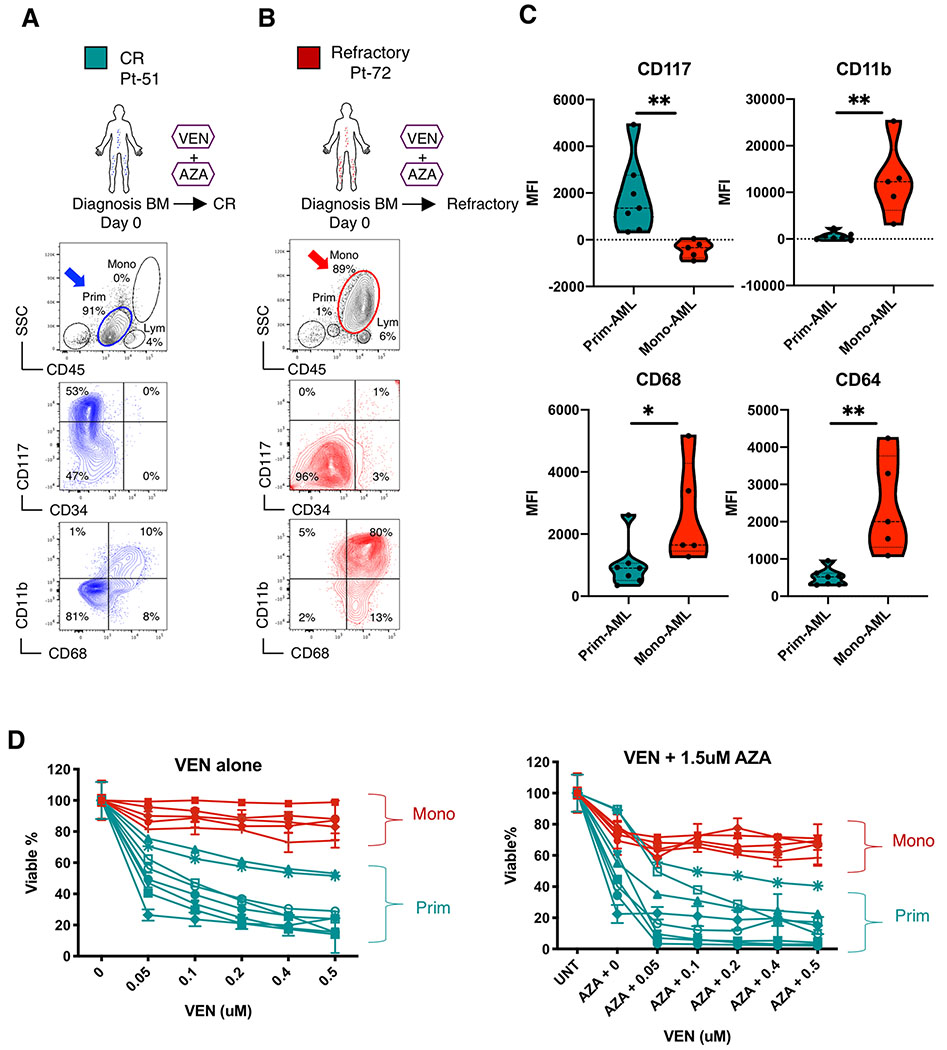
Figure 1. Monocytic AML is intrinsically resistant to venetoclax + azacitidine.
A, B, Treatment history of Pt-51, Pt-72 and flow analysis of their bone marrow specimens at diagnosis. In the CD45/SSC plots, Mono, Prim and Lym gates indicate monocytic, primitive and lymphocytic subpopulations, respectively. The CD34/CD117 and CD68/CD11b plots show immunophenotype of the gated primitive subpopulations in blue and monocytic subpopulations in red. Arrows highlight populations of interest. Clinical information for these patients is listed in Supplementary Table S1.
C, Violin plots showing median fluorescence intensity (MFI) of CD117, CD11b, CD68 and CD64 in mono-AML (N=5) and prim-AML (N=7) quantified by flow cytometry analysis. Each dot represents a unique AML. Mann-Whitney test was used to determine significance.
D, Viability of sorted ROSlow LSCs from mono-AML (N=5) and prim-AML (N=7) after 24 hours in vitro treatment with VEN alone or in combination with a fixed dose of 1.5 uM AZA. Mean +/− SD of technical triplicates. All viability data were normalized to untreated controls.

