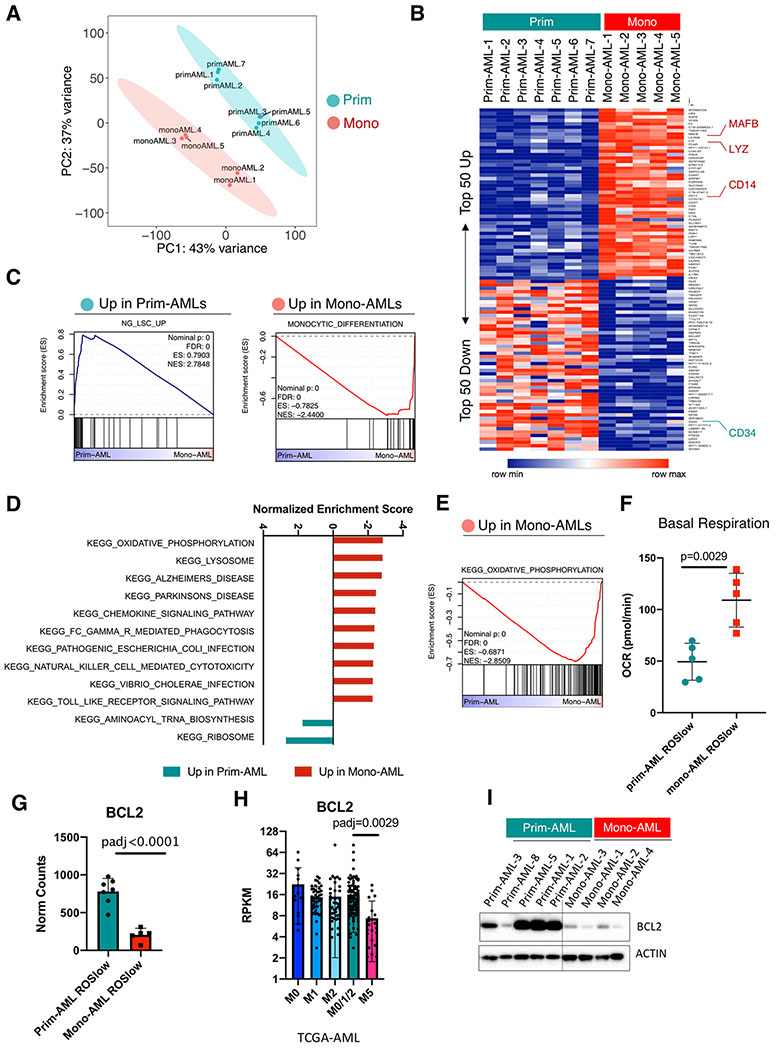
Figure 2. Monocytic AML is biologically distinct from primitive AML and loses expression of venetoclax target BCL2.
A, PCA analysis of the bulk RNA-seq data showing clear segregation of ROSlow mono-AML (N=5) from ROSlow prim-AML (N=7).
B, Heatmap showing expression of top 50 up- and down-regulated genes in ROSlow mono-AML (N=5) relative to ROSlow prim-AML (N=7), MAFB, LYZ and CD14 are highlighted as monocytic markers; CD34 is highlighted as a primitive marker.
C, GSEA enrichment plots showing up-regulated gene sets in prim- or mono-AML specimens.
D, Bar graphs showing normalized enrichment score (NES) of top-ranked gene sets produced by GSEA analysis of mono-AML versus prim-AML bulk RNA-seq data using the KEGG gene set collection.
E, A GSEA enrichment plot showing up-regulated OXPHOS gene sent in mono-AML.
F, Basal respiration rate in ROSlow prim-AML (N=5) versus ROSlow mono-AML (N=5). Each dot represents a unique AML. Mean +/− SD.
G, Bar graphs showing expression of BCL2 in ROSlow prim-AML (N=7) and ROSlow mono-AML (N=5). Each dot represents a unique AML. Mean +/− SD.
H. Bar graphs showing expression of BCL2 in FAB-M0 (N=16), M1 (N=44), M2 (N=40), M0/1/2 (N=100) and M5 (N=21) subclasses of AMLs from the TCGA dataset. Each dot represents a unique AML.
I, Western blot results showing protein level expression of BCL2 in prim-AML (N=5) and mono-AML (N=4). Actin is used as loading control.

