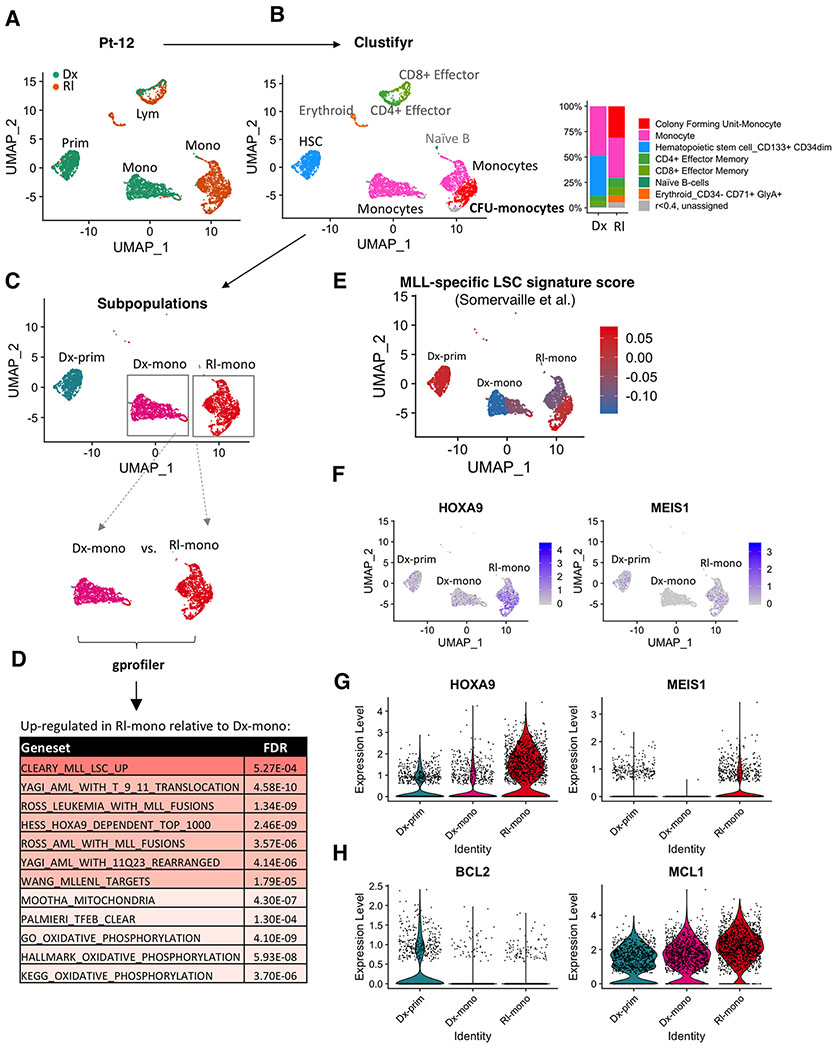
Figure 5. Monocytic disease at relapse has activated MLL-specific LSC programs and sustained reliance on MCL1.
A, UMAP plots of single cell RNA-seq data generated from CITE-seq analysis of paired diagnosis (Dx) and relapse (Rl) specimens from Pt-12. Each cluster represents a subpopulation of biologically similar cells clustered by their transcriptome similarity. Each dot within each cluster represents a single cell. Teal indicates cells from diagnosis, Brown indicates cells from relapse. Also see supplementary Fig. S5A,B.
B, Clustifyr analysis assigning each cluster to its closest normal hematopoietic lineage counterpart according to their transcriptome similarity. Bar graph comparing relative percentage of each subcluster in diagnosis and relapse specimens.
C, Major myeloid subpopulations analyzed in subsequent analyses.
D, Gprofiler analysis results showing significantly upregulated gene sets in the “Rl-mono” cluster relative to the “Dx-mono” cluster.
E, A heatmap showing relative expression of MLL-specific LSC gene expression signature at single cell resolution. Red indicates strong positive expression of MLL-specific LSC signature; Blue indicates a negative expression pattern suggesting non-LSC nature.
F, A heatmap showing relative expression of HOXA9 and MEIS1 at single cell resolution.
G,H, Violin plots showing relative expression of HOXA9, MEIS1, BCL2 and MCL1 in different clusters. Each dot represents a single cell.

