Figure 3.
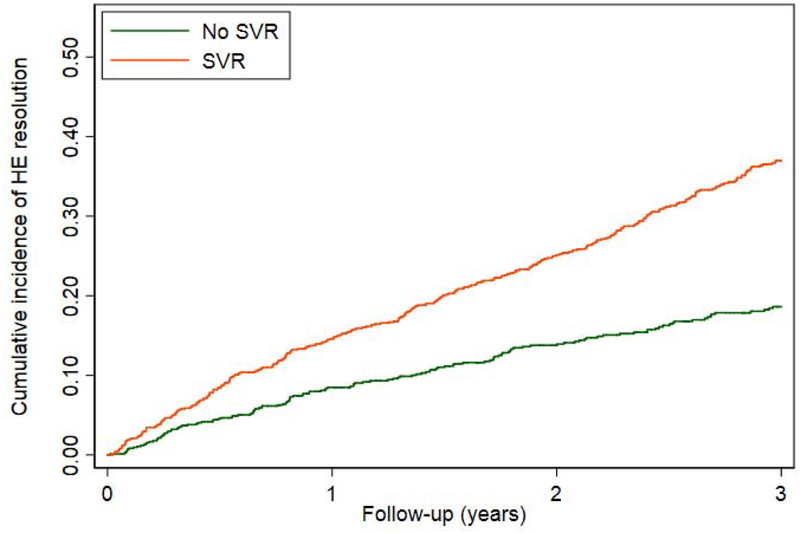
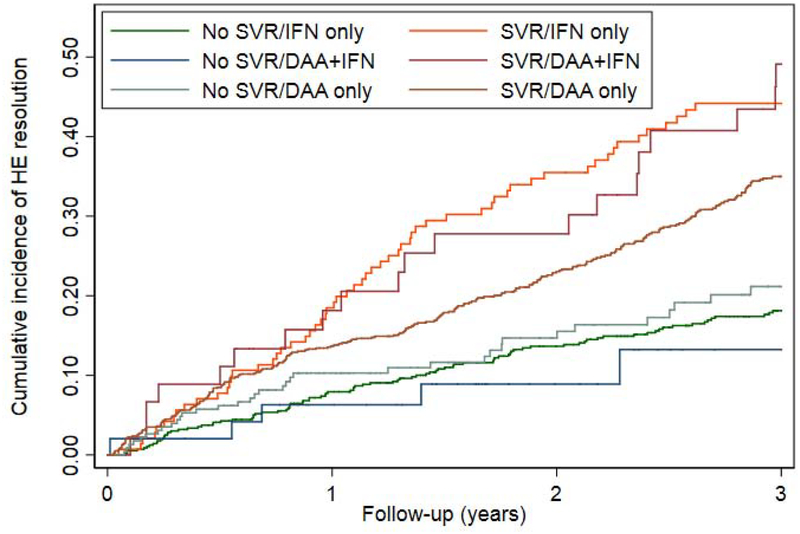
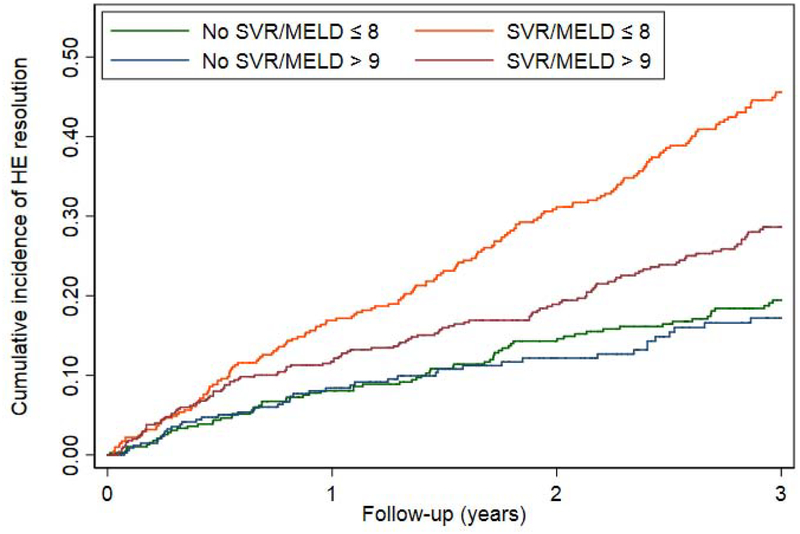
Cumulative probability curves comparing the resolution of HE in patients with SVR versus those without SVR among all patients or clinically-relevant subgroups.
a. All patients
b. By antiviral regimen
c. By MELD category
DAA = direct acting antivirals, IFN = interferon, MELD = model for endstage liver disease, SVR = sustained virologic response


