
Fig. 6: Gene expression changes in F3 progeny are associated with ancestral folate supplementation.
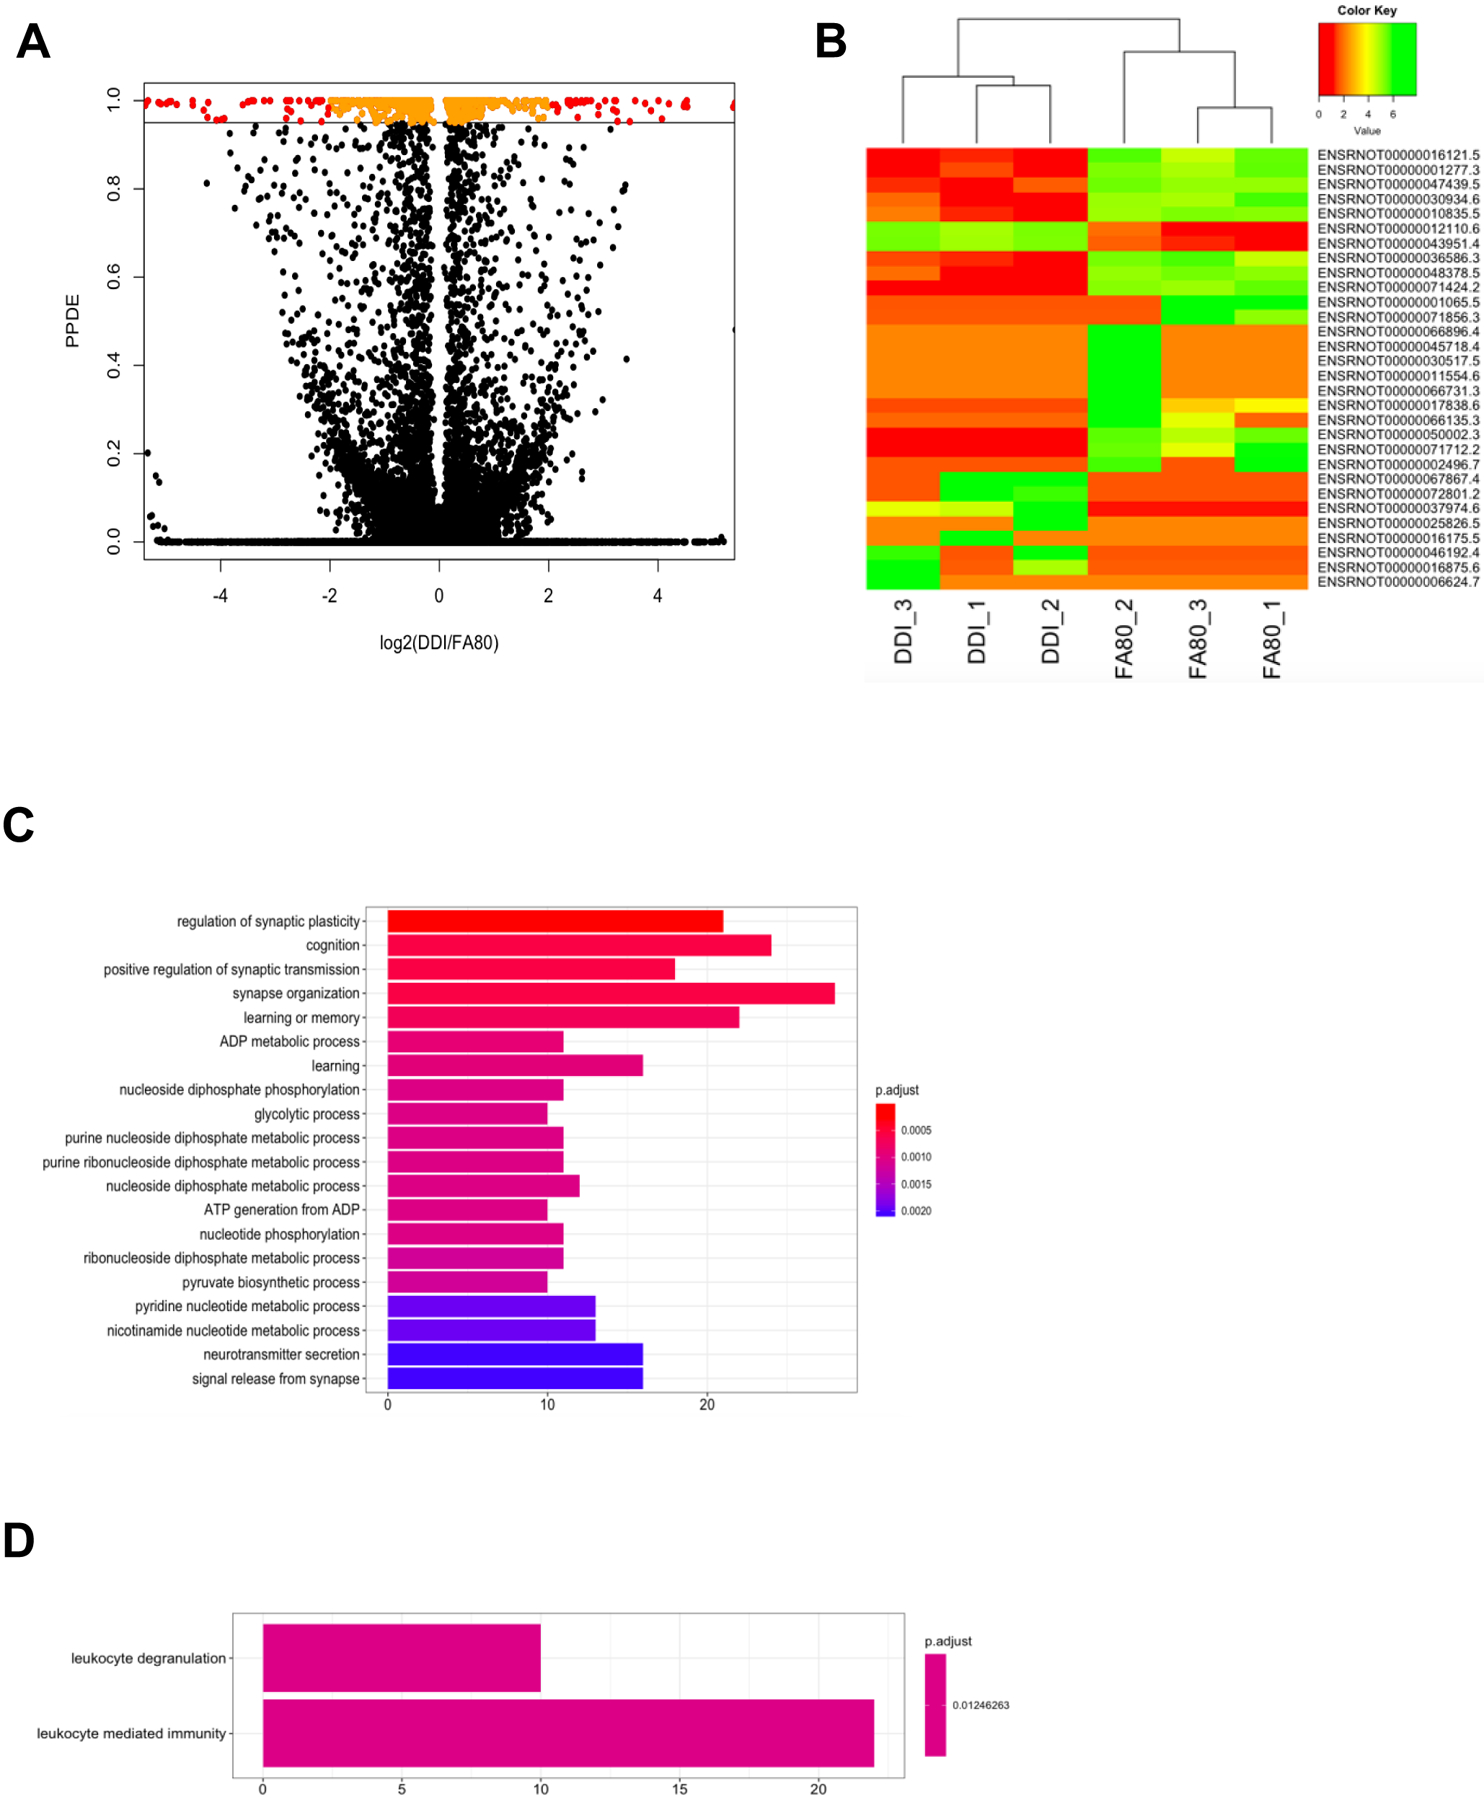
(A) A modified volcano plot depicts transcripts that are significantly dysregulated by ancestral folate. The –log2 value of the fold-change between DDI and FA80 is depicted on the x-axis while the posterior probability of differential expression (PPDE; analog of the adjusted P-value), as determined by EBSeq, is displayed on the y-axis. Transcripts with a PPDE >0.95 with a −log2(fold-change) < 2x are depicted in orange. Transcripts with a PPDE >0.95 with a –log2(fold-change) > 2x are depicted in red. Nonsignificant transcripts are shown in black. (B) A heat map of the top 30 dysregulated transcripts (y-axis) sequester FA80 samples from DDI samples (x-axis). Low expression of transcripts (log(read counts+1)) are depicted in red and range to high expression depicted in green. (C and D) The top gene ontology terms of biological processes for down-regulated genes (C) and up-regulated genes (D) are displayed. The number of dysregulated genes (x-axis) associated with the term (y-axis) are color-coordinated based on the adjusted P-value.