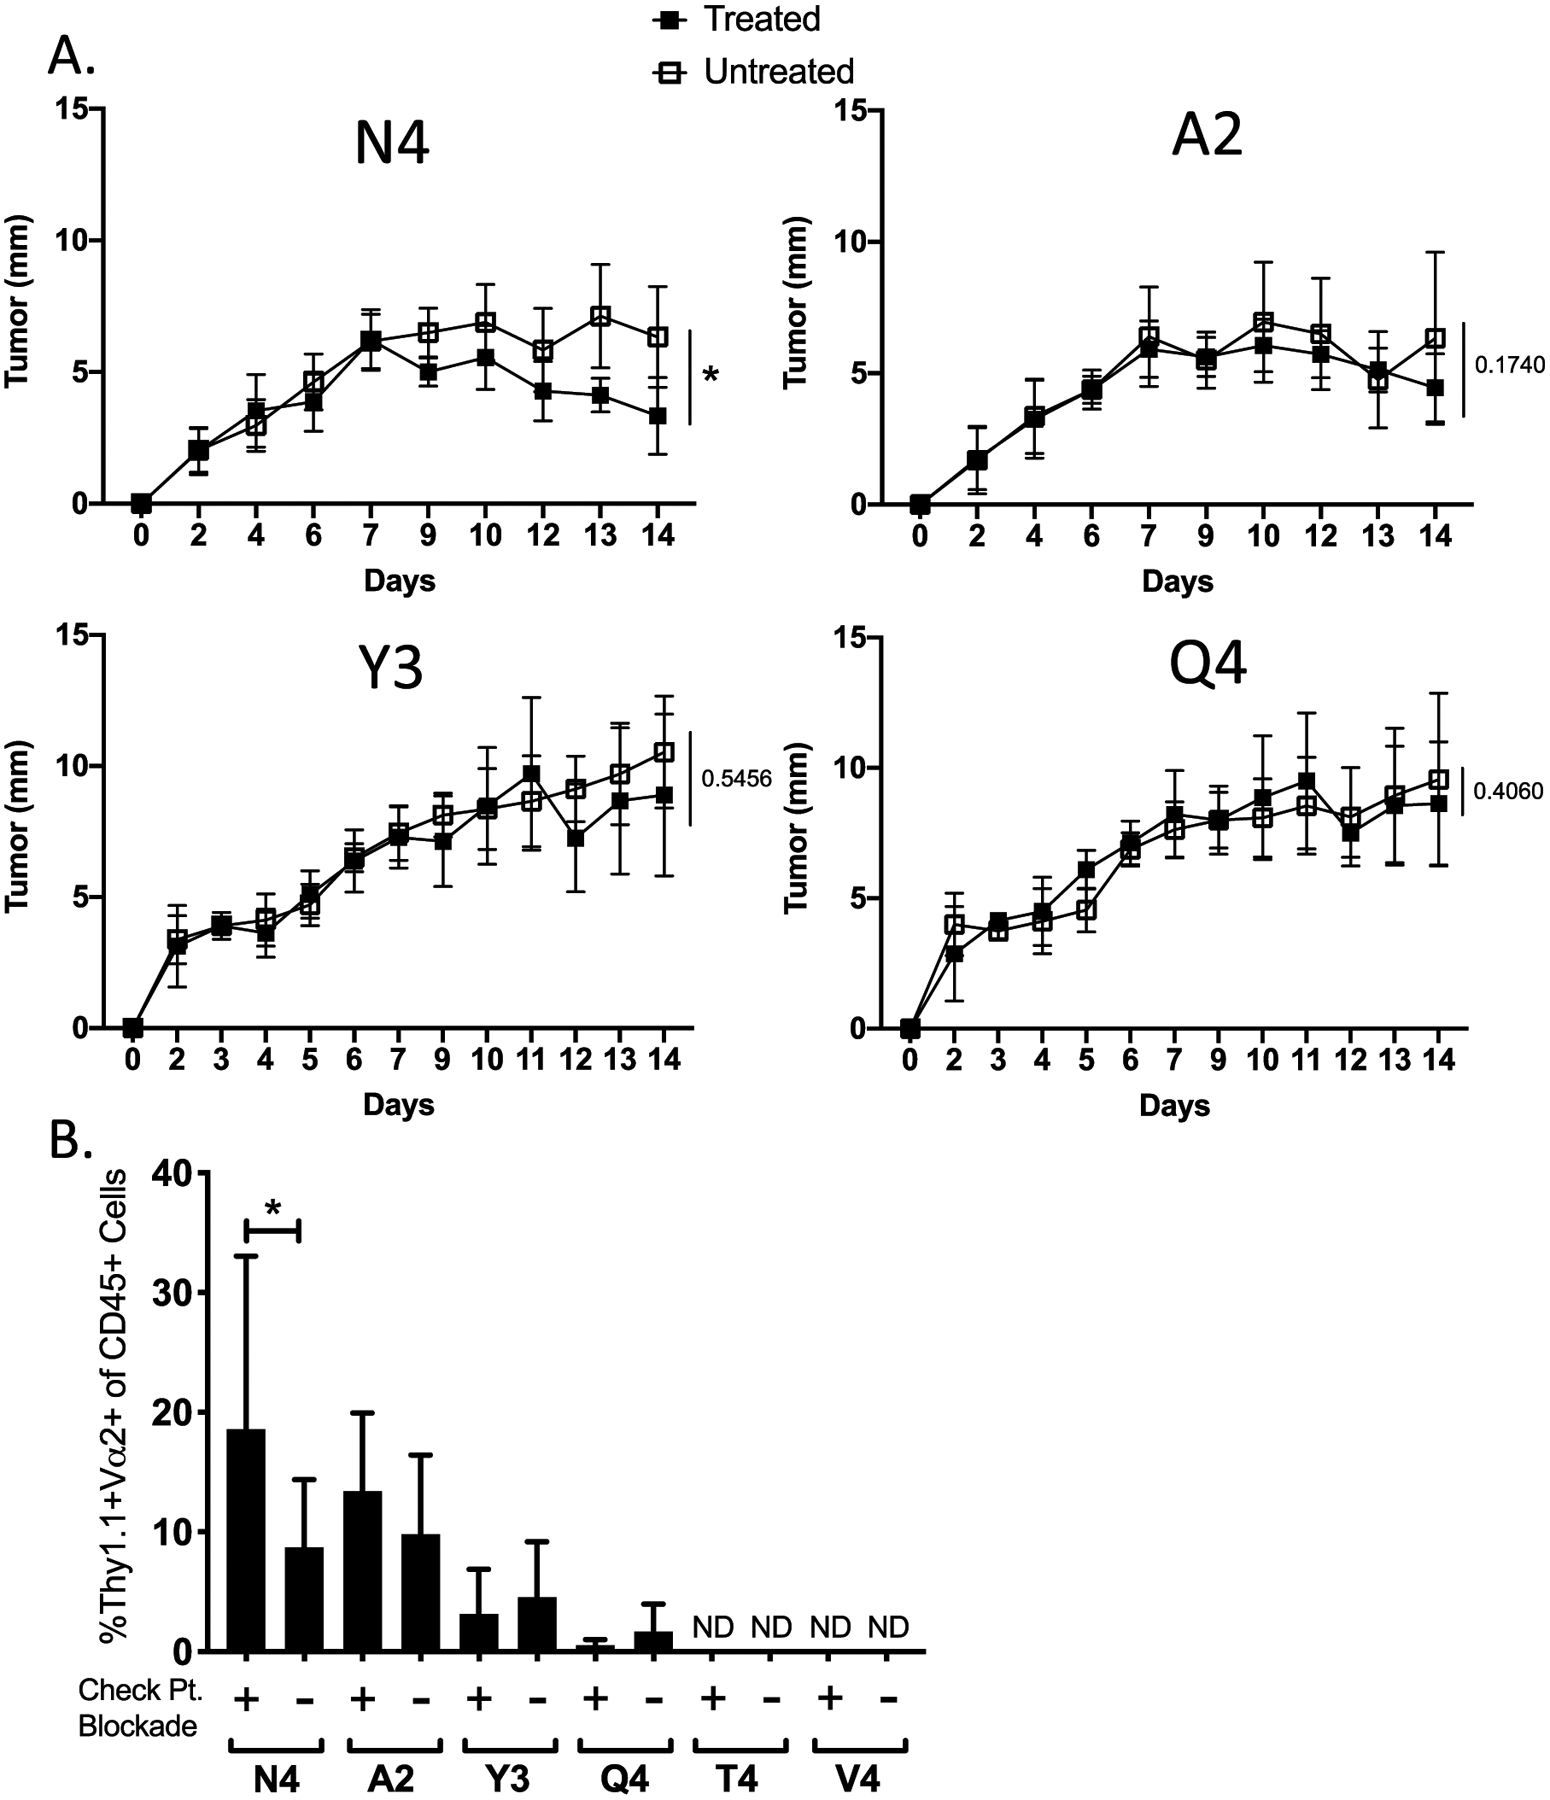
Figure 2:

Checkpoint blockade therapy preferentially enhances high-affinity T cell responses. (A) Line graphs show the average growth kinetics of the different B16-OVA(APL) tumors in the presence (filled square) or absence (open square) of checkpoint blockade therapy administered on days 7 and 10 post tumor inoculation. (B) Bar graph indicates the frequency of OT-Is in the CD45+ population within each tumor subset at day 14 post implantation. Error bars indicate SD. Statistical significance was determined by comparing the area under the tumor growth curve (A) or group means (B) using an unpaired t test (n=18 mice per group, representative of two independent experiments). *P < 0.05, **P < 0.01, ***P < 0.001, ****P < 0.0001.
