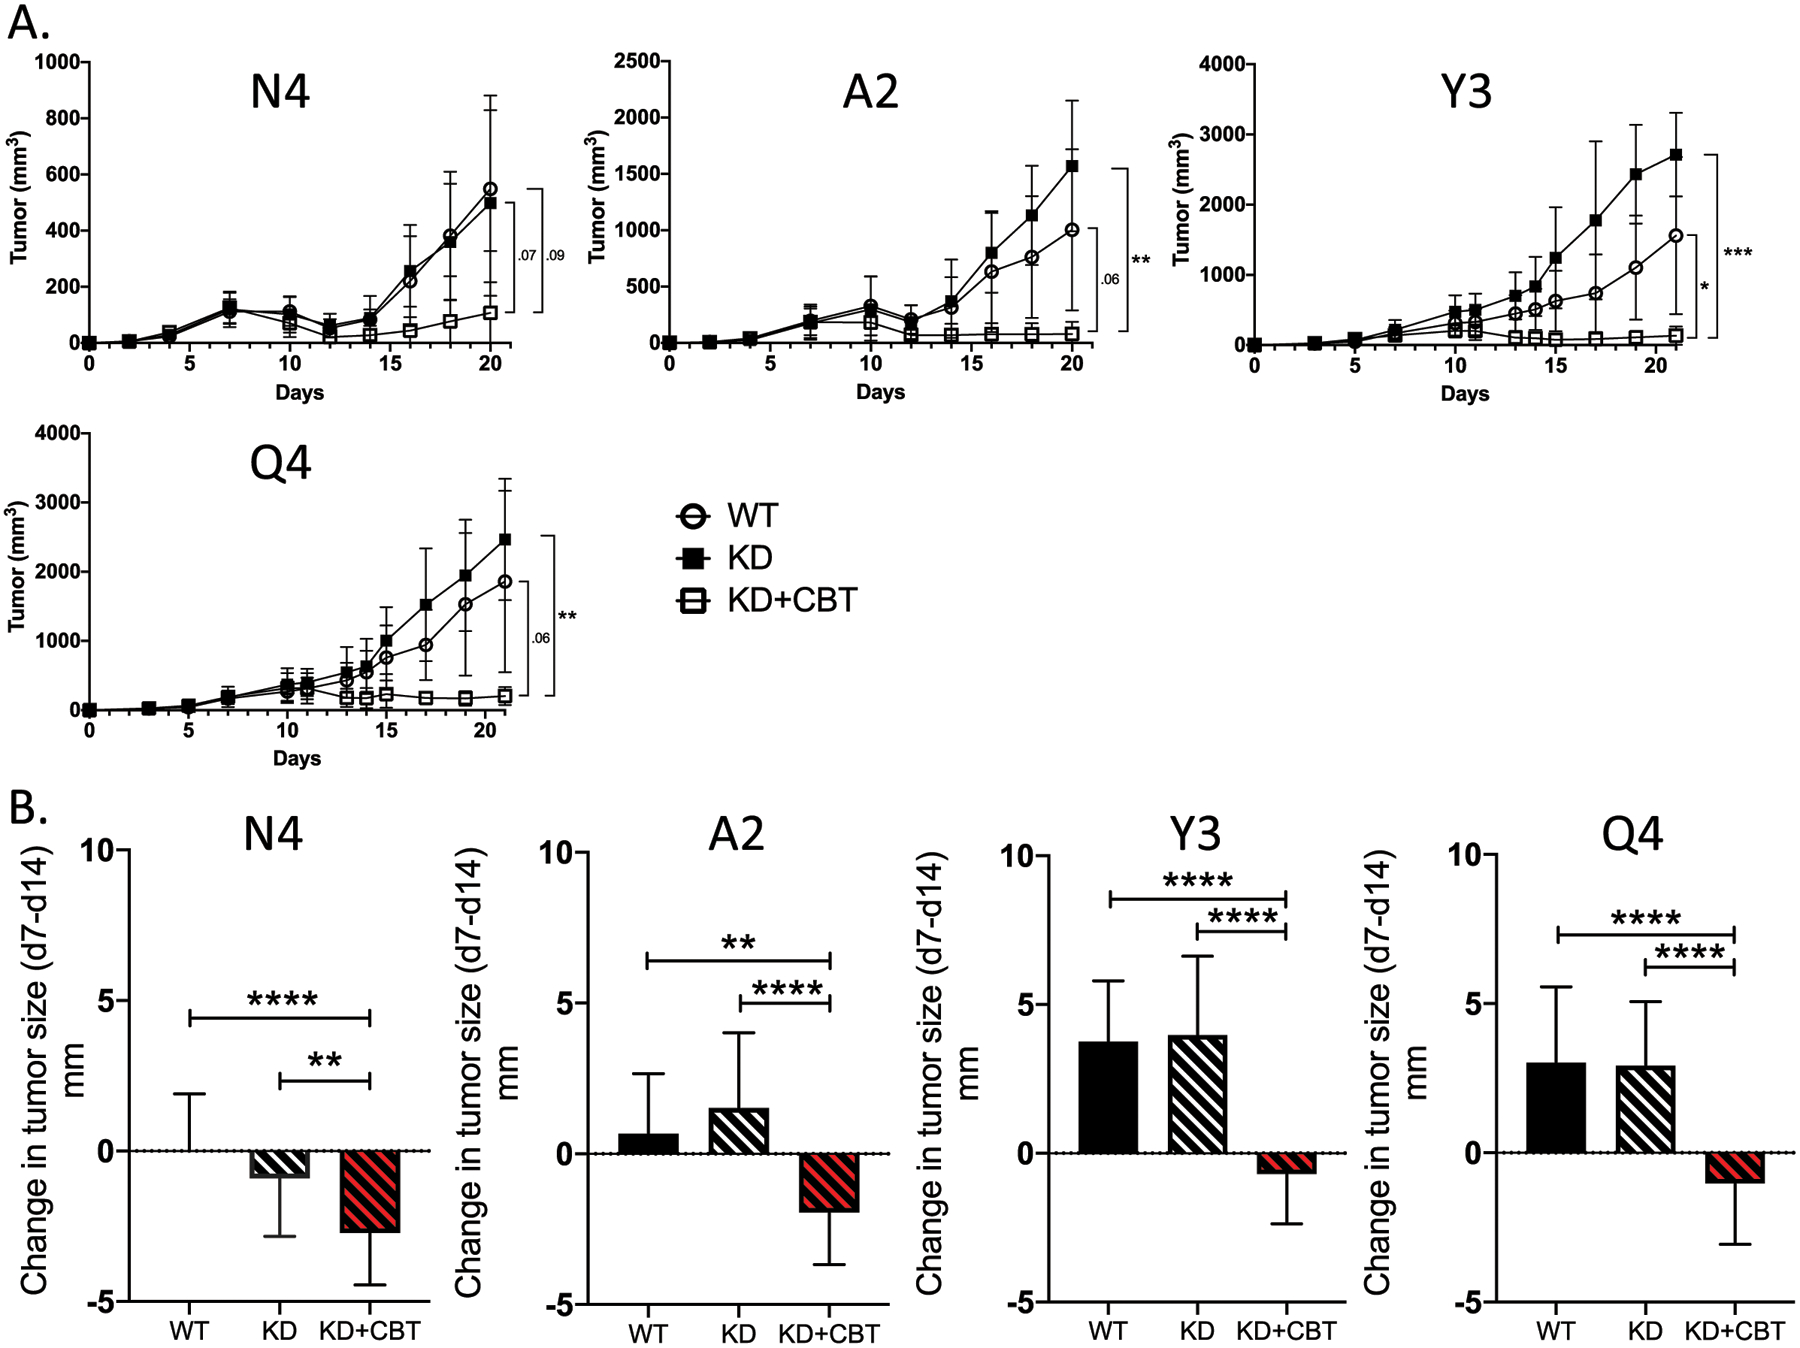
Figure 6:

Inhibition of SHP-1, combined with ICB, promotes tumor regression across a wide range of tumor antigen affinities. (A) Line graphs indicate the growth kinetics of tumors in the presence of WT OT-I CD8+ T cells (open circle), SHP-1 KD OT-Is (filled square) and SHP-1 KD OT-Is in the presence of ICB (open square). (B) Bar graphs show the change in tumor diameter between day 7 (pre-treatment) and day 14 (post-treatment). Comparisons between WT (solid), SHP-1 KD (black dashed), and SHP-1 KD with CB treatment (red dashed) are made for each OVA(APL). Error bars indicate SD. Statistical significance was determined by comparing the area under the tumor growth curve (A) or group mean (B) using an unpaired t test (n=10–15 mice per group, representative of two independent experiments). *P < 0.05, **P < 0.01, ***P < 0.001.
