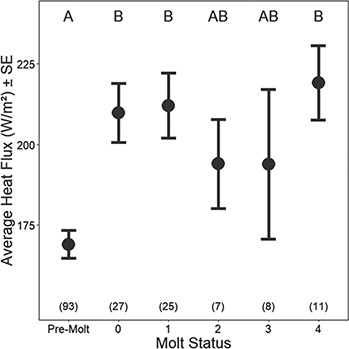
Figure 5.

Average HF (W/m2) ± SE values as measured on dry-fur across the molt progression of handled seals. Significant differences between each molt status are shown with different letters at the top of the panel, and sample sizes for each molt status are shown in parentheses at the bottom.
