
Figure 1.
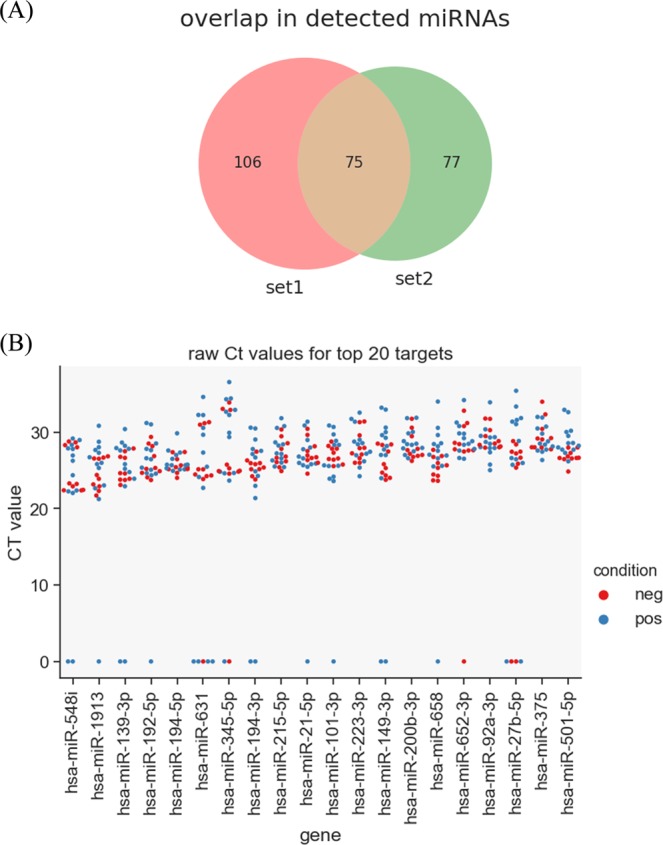
Characterisation of bovine faecal miRNome. (A) Overlap between miRNAs detected in both PCR panel sets from experiment 1 (set 1) and experiment 2 (set 2). (B) Raw Ct values generated by miRNome PCR panels for the 20 highest expressed miRNAs in bovine faeces (clinical JD – n = 13, negative controls – n = 10). Poor quality samples are shown as zero Ct. There was no significant difference between positive and negative samples.