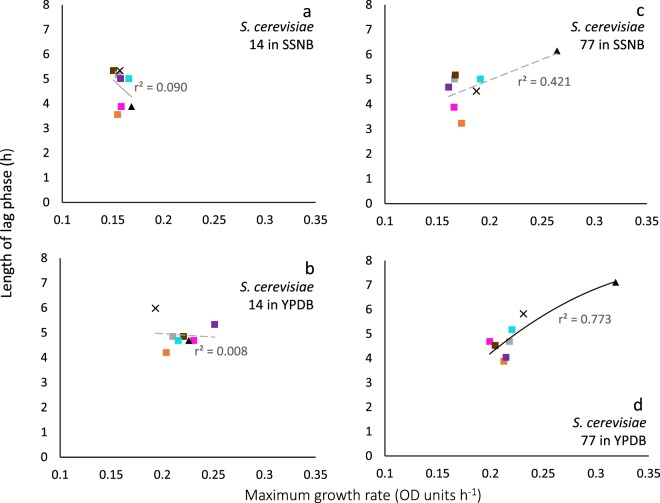
Figure 6.
Length of lag phase versus maximum rate of growth for Saccharomyces cerevisiae at 30 °C: strain 14 in salt-supplemented nutrient broth (SSNB) (a) and yeast extract peptone dextrose broth (YPDB) (b); and strain 77 in SSNB (c) and YPDB (d). Cells suspended in water (not subjected to any dehydration treatment) (pink squares), and cells suspended in 1 M xylitol (no dehydration treatment) (orange squares), were used as controls. For dehydrated cells, rehydration treatments were either rapid, using water (grey squares); rapid, using 1 M xylitol (brown squares); gradual, using water vapour then rapid in water (purple squares); or gradual rehydration with water vapor, then rapid in 1 M xylitol (turquoise squares) or for xylitol dehydrated cells; gradual, using water vapour then rapid in water (×); and gradual, using water vapour then rapid in 1 M xylitol (▲). Trend lines showing a strong correlation between data are indicated by a solid black line (d), while inconsistency between lag and growth rates (i.e. no correlation was observed) is indicated by a dashed grey line (a–c).

