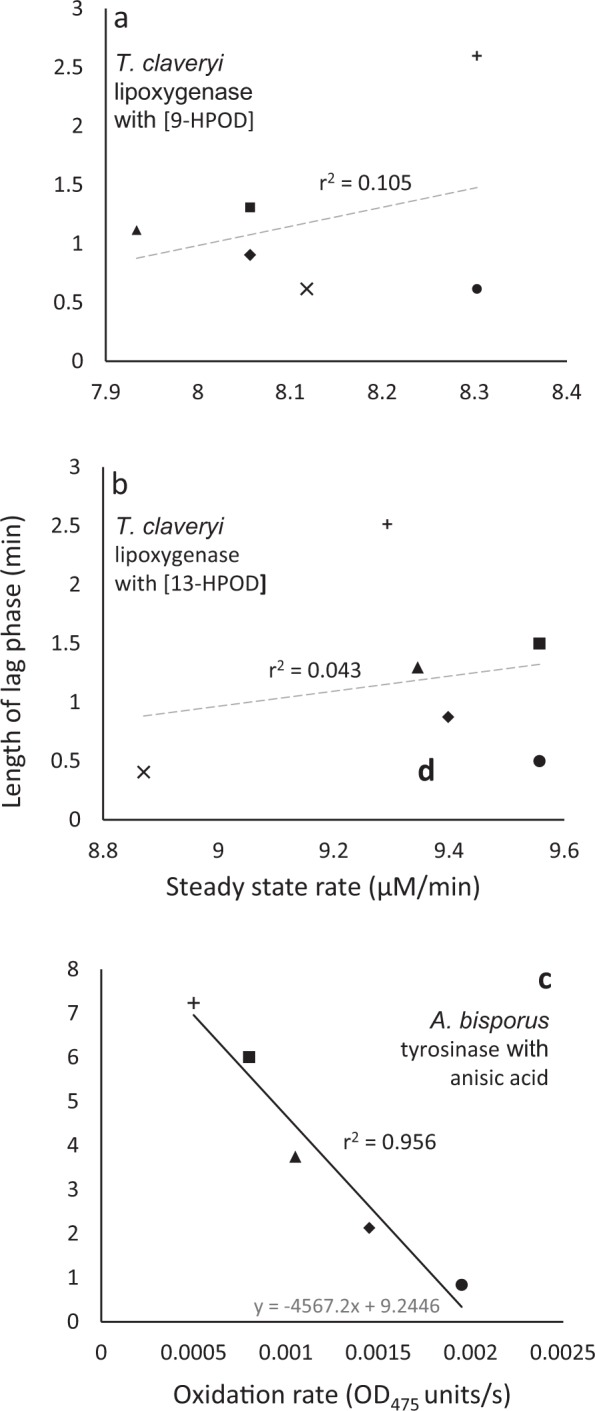
Figure 9.

Length of lag phase versus steady-state rate for T. claveryi lipoxygenase activity exposed to two hydroperoxy octadecadienoic acids; (a) 9-HPOD and (b) 13-HPOD; and A. bisporus tyrosinase exposed to a carboxylic acid; (c) anisic acid. For the hydroperoxy octadecadienoic acids, media composition consisted of 180 µM linoleic acid, and 0.01 unit of Terfezia claveryi LOX in sodium borate buffer at pH 10.0 and media were supplemented with: (a) 9-HPOD at 16.28 (×), 14.99 (●), 7.54 (♦), 5.23 (▲), and 2.66 mM (■) and without 9-HPOD (control; +); (b) 13-HPOD at 19.54 (×), 0.81 (●), 0.32 (♦), 0.24 (▲), and 0.16 mM (■) and without 13-HPOD (control; +). The reaction medum (3 ml) for the carboxylic acid consisted of 0.5 mM of tyrosine in 50 mM sodium phosphate buffer (pH 6.8), mushroom tyrosinase 33.3 µg/ml and media were supplemented with (c) anisic acid at 3 (●), 2 (■), 1 (▲), and 0.4 (♦) mM, and without anisic acid (control; +). Trend lines showing a strong correlation between data are solid and black (c,d), while dashed grey lines indicate inconsistency between lag and steady-state rate (i.e. no correlation was observed) (a,b).
