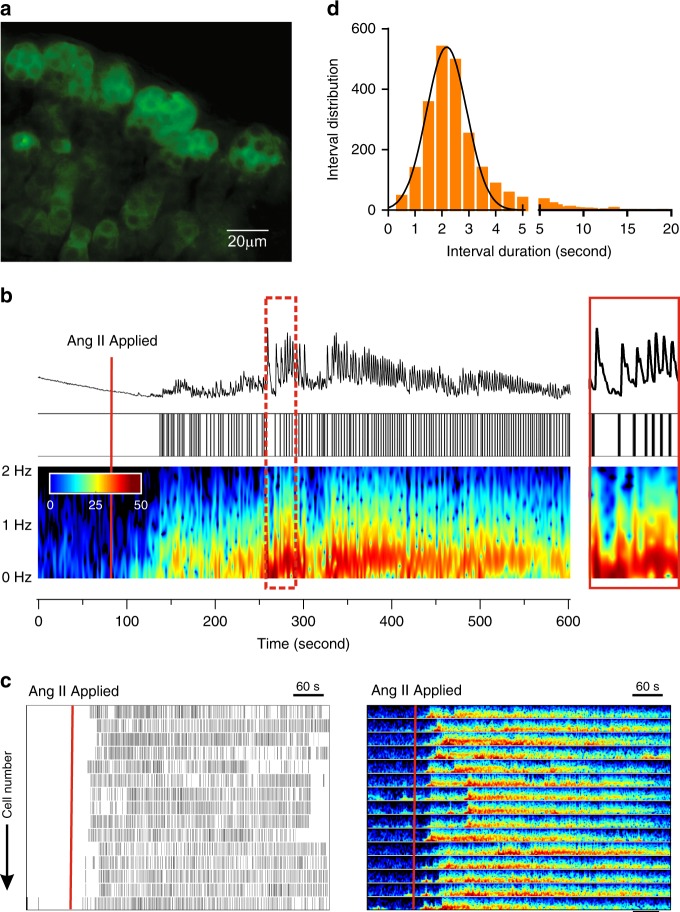
Fig. 1. Ang II-elicited calcium signaling in zG cells expressing GCaMP3.
a Photomicrograph (63 × magnification) of adrenal slice from a zG-GCaMP3 expressing mouse before Ang II stimulation. Individual cells within rosettes can be distinguished by their dark nucleus, surrounded by cytosolic GCaMP3. Scale bar: 20 µm. b Representative trace of fluorescence intensity (top) imaged in a zG cell before and after stimulation with 3 nM Ang II (red line, 90 s after start of record) and corresponding raster plot (middle) of calcium spikes captured at 20 Hz for 10 min. (bottom) Spectrogram of oscillation frequency after Fourier transformation. A magnification of the region indicated by dashed red rectangle is provided on the far right. c Raster plot of calcium spikes (left) and corresponding spectrogram of oscillation frequencies (right) from all cells measured in a single adrenal slice. Solid red line indicates when 3 nM Ang II was added to the bath solution. Scale bar: 60 s. d Frequency distribution of inter-calcium spike intervals (0.1 min bins) elicited by 3 nM Ang II is normally distributed (mean ± SEM [Hz]: 0.519 ± 0.006, n = 24,052). Source data are provided as a Source Data file.

