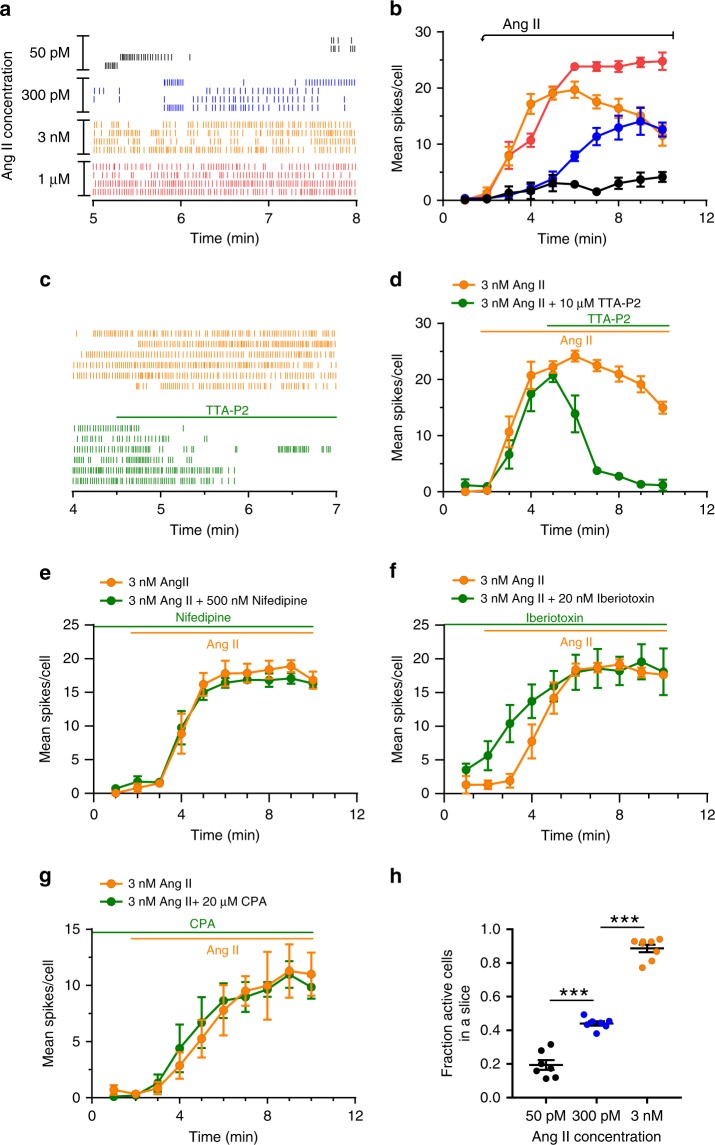
Fig. 2. Calcium spikes elicited by Ang II are dose dependent and require CaV3 channel activity.
a Representative raster plot of calcium spikes after treatment with 50 pM, 300 pM, 3 nM, or 1 µM Ang II. b Mean spikes/cell dose dependently increases with Ang II (50 pM: n = 5 slices, 94 cells; 300 pM: n = 6 slices, 247 cells; 3 nM: n = 8 slices, 165 cells; 1 µM: n = 4 slices, 90 cells); 2-way ANOVA: P < 0.0001 indicating an overall effect of time and dose. c Raster of representative cells and d mean spikes/cell with application of the Cav3 channel antagonist TTA-P2 (10 µM). TTA-P2 (applied at 4.5 min) inhibits calcium spikes elicited by 3 nM Ang II (applied at 1.5 min). TTA-P2: n = 4, 96 cells; No TTA-P2: n = 4, 90 cells; 2-way ANOVA: P < 0.0001 for overall effect of time and drug. e 500 nM nifedipine (n = 4 per group) had no significant effect on 3 nM Ang II induced activity (2-way ANOVA: P = 0.942). f However, 20 nM Iberiotoxin resulted in a more rapid onset of spikes, although the overall effect of drug (P = 0.270) or drug × time (P = 0.071) was not found to be significant across the 10 min period (n = 4 per group, 2-way ANOVA). g 20 µM CPA did not inhibit calcium spikes, indicating intracellular calcium stores are not required for calcium oscillations. CPA: n = 5 slices, 89 cells; No CPA: n = 5 slices, 106 cells; 2-way ANOVA: P = 0.94 for CPA effect. h Fraction of cells that responded to submaximal Ang II dose compared to active cells at 1 µM Ang II; mean ± SEM: 50 pM: 0.19 ± 0.03, n = 7 slices; 300 pM: 0.44 ± 0.01, n = 7 slices, 3 nM: 0.89 ± 0.02, n = 8. One-way ANOVA, P < 0.001; Tukey’s multiple comparisons test: 50 pM vs 300 pM: ***P < 0.0001, 50 pM vs 3 nM: ***P < 0.0001, 300 pM vs 3 nM: ***P < 0.0001. b, d–h Mean data from each mouse were represented as a single point in calculating N/experimental condition. Lines and symbols are color coded according to experimental condition; 50 pM: black, 300 pM Ang II: blue, 3 nM Ang II: orange, 1 µM Ang II: red, 3 nM Ang II + drug (10 µM TTA-P2, 500 nM nifedipine, 20 nM iberiotoxin, or 20µM CPA): green. Source data are provided as a Source Data file.

