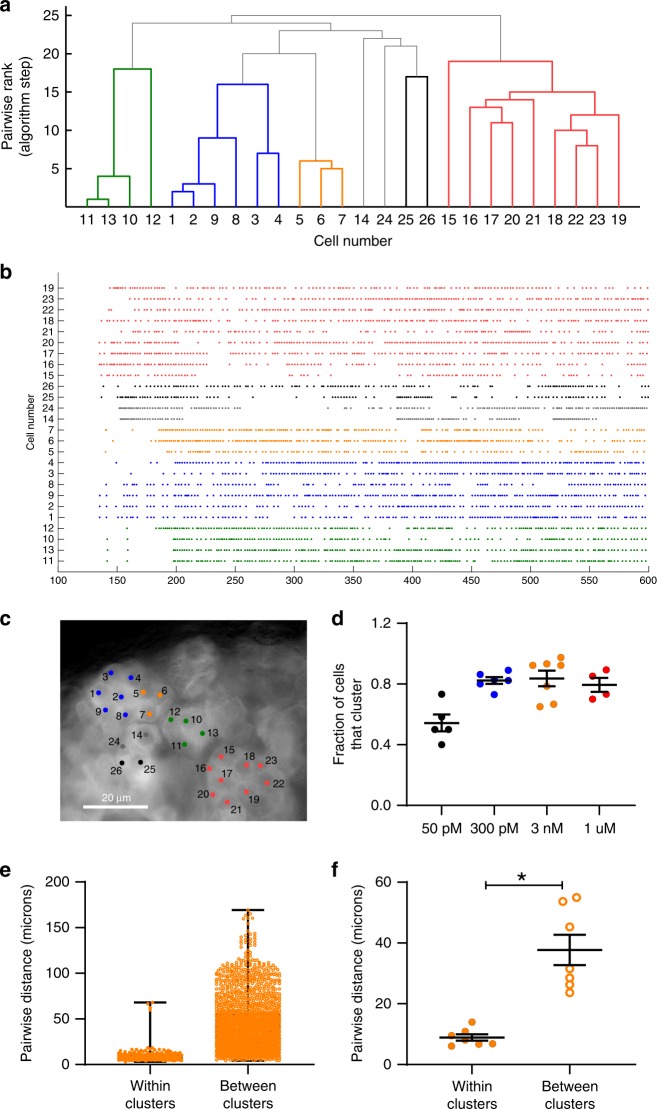
Fig. 5. zG cells within rosettes functionally cluster with neighboring cells after stimulation with 3 nM Ang II.
Representative data from an adrenal slice stimulated with 3 nM Ang II. a Dendrogram output from the functional clustering algorithm (FCA) for ROIs shown in c, indicating cell pairings based on calcium spike synchrony. Cells (ROIs) are numbered for identification (x-axis), and are ranked pair-wise (y-axis) by the FCA based on the mean least (temporal) distance between spikes of each cell; those that pair best are ranked lowest on the dendrogram and grouped together (i.e., 1 on the y-axis), while pairs with more diverse temporal spike relationships appear higher on the dendrogram. Each color represents a group of cells that significantly paired with each other (i.e., a cluster). b Raster plot of calcium spikes by time (s) across all cells marked, arranged by groupings and the (c) corresponding ROIs selected in the slice experiment. d Across Ang II concentrations, most cells were assigned to a cluster group; however, a significantly smaller fraction of cells cluster at 50 pM (means ± SEM: 50 pM (black, n = 5 slices): 0.543 ± 0.056; 300 pM (blue, n = 6 slices): 0.823 ± 0.023; 3 nM (orange, n = 7 slices): 0.837 ± 0.051; 1 µM (red, n = 4 slices): 0.795 ± 0.046; 1-way ANOVA: P = 0.0009, Bonferroni: P ≤ 0.017 for 50 pM vs 300 pM, 3 nM, and 1 µM). e, f The distance between cells that cluster is markedly smaller than cells that do not pair (e, box plot of all paired distances across 7 experiments after 3 nM Ang II, median value (25–75%) [µm]: clustered: 7.2 (5.7–10.8), n = 226); non-clustered: 37.0 (21.8–56.4), n = 1827). f Means ± SEM (µm) per adrenal experiment (3 nM Ang II, n = 7): clustered: 8.9 ± 1.1; non-clustered: 37.7 ± 5.0; Mann–Whitney test: *P = 0.0156. Mean data from each mouse were represented as a single point in calculating N/experimental condition. Source data are provided as a Source Data file.

