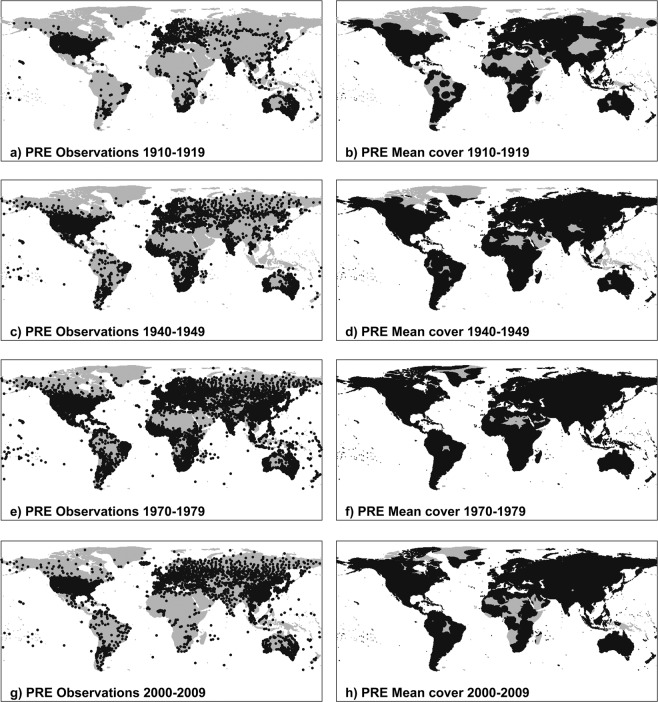
Fig. 1.
Station coverage for PRE (total precipitation). Decades included are 1910–1919 (a,b), 1940–49 (c,d), 1970–79 (e,f) and 2000–09 (g,h), showing station locations (left column) and resulting cover (right column). Additional cover from the background climatology is not shown. The CDD for PRE is 450 km. Stations appear if they contribute at least 75% of observations in the decade; grid cell cover is shown where a gridcell has interpolated data for at least 75% of time steps in the decade. For this reason, discontinuities may be observed between each decadal pair.

