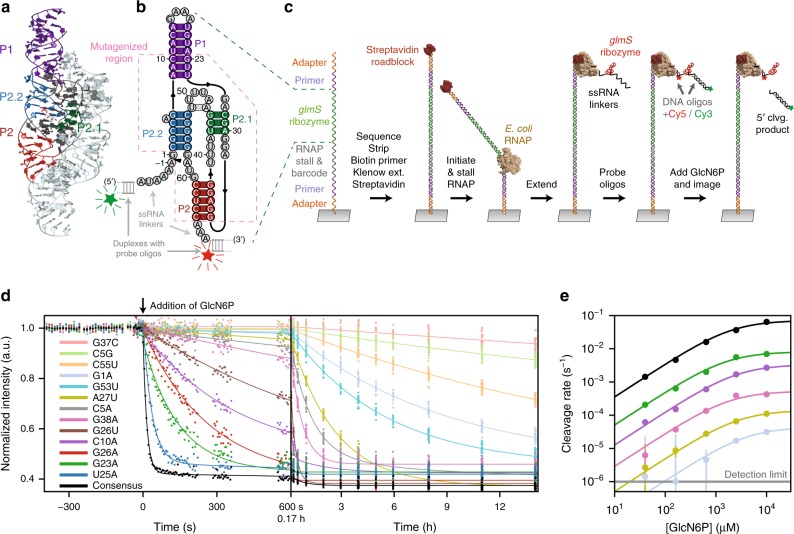
Fig. 1. RNA array assay for ribozyme self-cleavage.
a Crystal structure of the T. tengcongensis glmS ribozyme, PDB 2Z75, with duplex elements P1, P2, P2.1, and P2.2 indicated (core domain: dark colors; non-core domain, pale cyan). b Secondary structure of the 66-nt core construct studied; duplex color scheme same as in a. Flanking sequences and the region targeted for random mutagenesis by doped synthesis are also indicated. The sequence of the core construct is from ref. 24; the secondary structure is derived from crystallographic data (refs. 11, 16). c Schematic of sequential steps for the RNA array assay. Variants were transcribed in situ on a sequencing chip. Hybridized Cy3- and Cy5-dye labeled DNA oligomers scored the presence of the ribozyme. The Cy3 TIRF signal is lost upon cleavage, which releases the 5′ product. d Representative cleavage records for the consensus ribozyme and the 13 variants are indicated (color-coded), displayed on both short and long time scales (data points are median per-tile intensity values for the given variant). e, Representative Michaelis–Menten curve fits to cleavage rates, derived from RNA array data (as in d), as a function of GlcN6P concentration (error bars, std. err.). Same color code as in panel d. Source data are available in the Source Data file.

