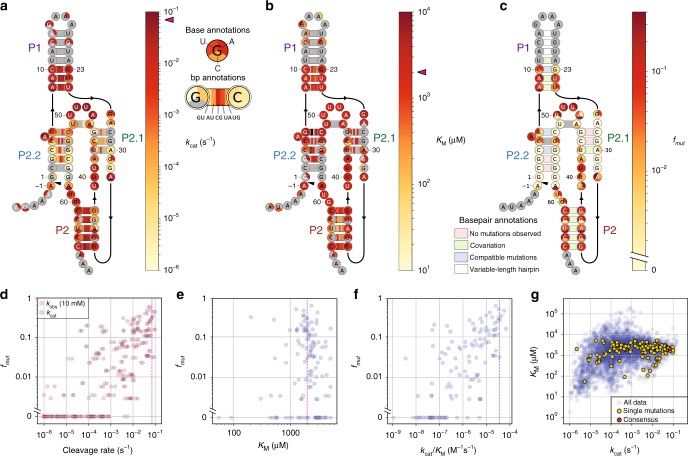
Fig. 2. Mutation frequency is tightly correlated with effects on the cleavage rate.
Structural heatmaps of kcat (a) and apparent KM (b) for all single mutants and basepaired-partner double mutants. Magenta arrowheads indicate consensus ribozyme values. c Structural heatmap of mutation frequency for point mutants, and previously reported basepair covariation, from ref. 9 (Methods). d–f Scatterplots of mutation frequency vs. cleavage rate (d), KM (e), and kcat/KM (f) for point mutants of the ribozyme core. Dotted magenta lines indicate consensus ribozyme values. g Scatterplot of KM vs. kcat for all variants for which both parameters were determined. Source data are available in the Source Data file.

