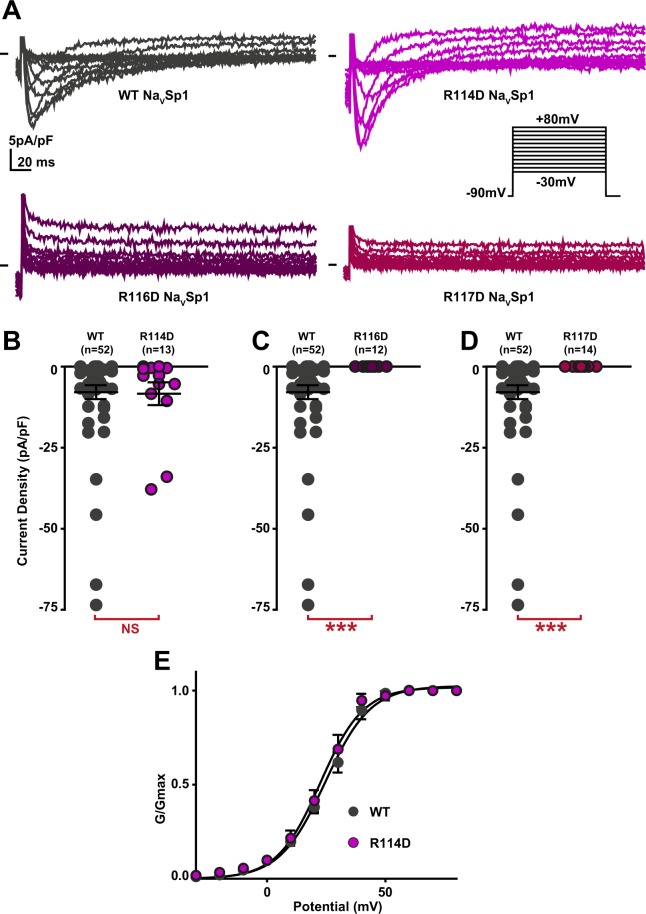
Figure 3.
Effect of charge reversal in amino acids present in NaVSp1 S4-S5L(−3) activating peptide on NaVSp1 current density and activation curve. (A) representative, superimposed recordings of WT and mutant NaVSp1 current. Activation voltage protocol used is the same as in Fig. 2. (B–D) Dot plot and mean ± sem of peak current densities recorded in COS-7 cells transfected with WT or mutant NaVSp1, at 30 mV. (E) Relative peak conductance versus membrane potential curves for WT or mutant NaVSp1 channels transfected in COS-7. Lines are Boltzmann fits to the data. ***p value vs. WT < 0.001.

