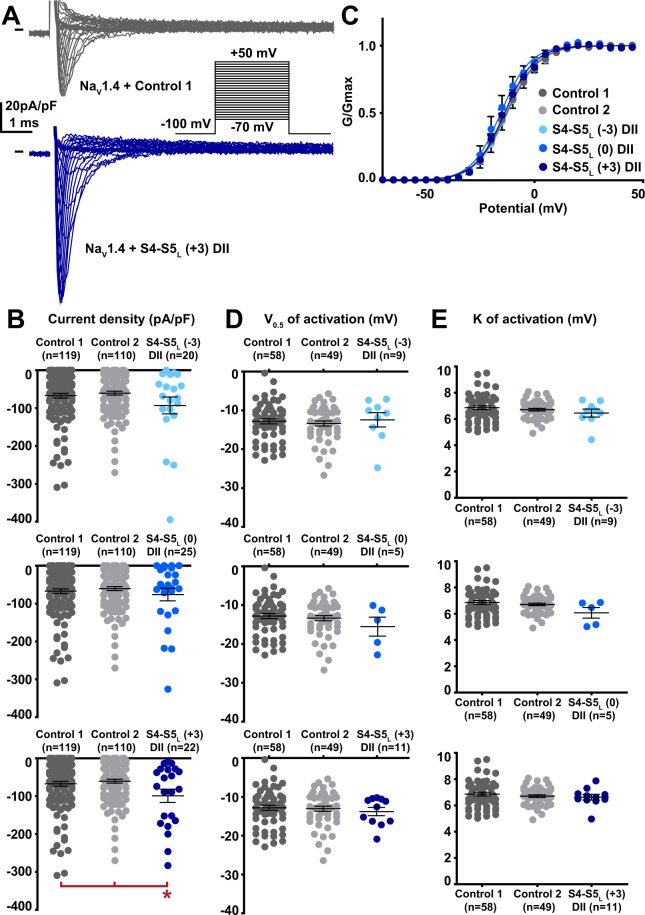
Figure 6.
Effect of NaV1.4 S4-S5L mimicking peptides of domain II on NaV1.4 current density and activation curve. (A) representative, superimposed current recordings in COS-7 cells co-transfected with NaV1.4, NaVß1, and control 1 (top trace) or domain II S4-S5L(+3) peptide (bottom trace). Inset: activation voltage protocol used (holding potential: −100 mV; 30-ms pulse; one sweep every 2 s). (B) Dot plot and mean ± sem of peak NaV1.4 current densities recorded in COS-7 cells co-transfected with NaV1.4, NaVß1, and the indicated peptide, at 0 mV. (C) Relative peak conductance versus membrane potential curves for NaV1.4 channels in the same cell groups as in (B). Lines are Boltzmann fits to the data. (D,E) Dot plot and mean ± sem of NaV1.4 half-activation potential (V0.5; D) and activation slope (K; E) in the same cells group as in (B). *p value vs. both controls <0.05.

