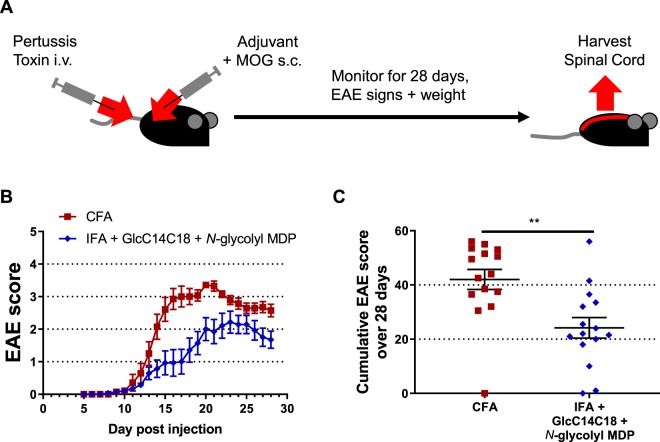
Figure 6.
RR-EAE induced by IFA+GlcC14C18+MDP. (A) Experimental timeline. (B) Average EAE score +/− SEM over time of mice induced with CFA (N = 15) or IFA + 10 µg GlcC14C18 + 30 µg N-glycolyl MDP (N = 15). Mice were euthanized on day 28 post injection. (C) Cumulative EAE score, obtained by adding the EAE score of each mouse over each of the 28 days. Lines represent averages +/− SEM. p-value was calculated with two-tailed student’s t-test. **p = 0.0022.

