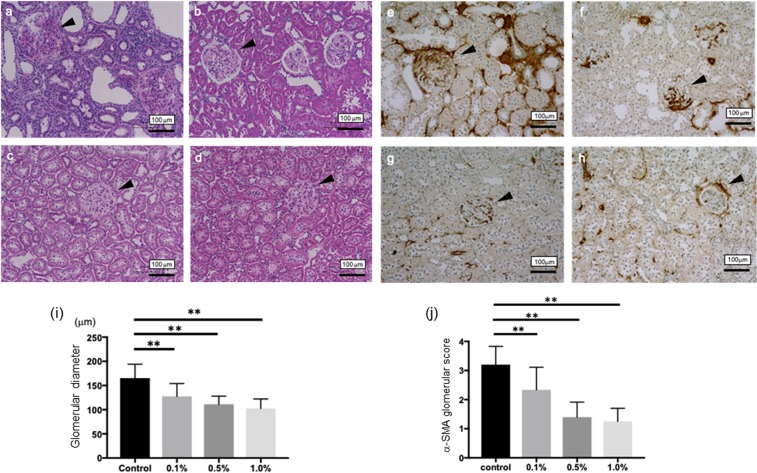
Figure 3.
Representative morphological changes in the control group (a,e) or the Si-based agent (0.1wt.%: b,f, 0.5wt.%: c,g, 1.0wt.%: d,h) groups, respectively. Scale bar: 100 µm. The dilations of glomeruli and the increase of mesangial matrix (arrowhead) are examined. The diameters of glomeruli were assessed using a color image analyzer and compared among each group (i). Mesangial matrix levels were assessed according to previously described method scored from 0 to 4 with α-SMA staining: 0, no mesangial matrix expansion; 1, minor; 2, weak; 3, moderate; and 4. The scores were averaged and compared among each group (j). (**p < 0.01, *p < 0.05).

