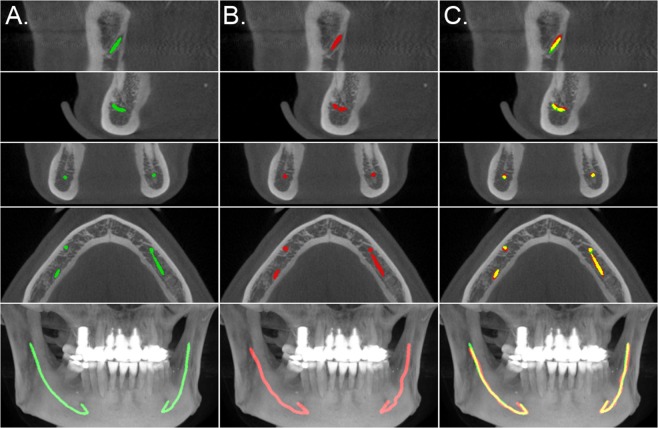
Figure 3.
Comparison of the model segmentation and the ground truth, from the secondary test data annotations, for a CBCT scan. (A) visualises the segmentation of the model, in green, (B) the interpolated control point annotation, in red, and (C) the overlap between the model segmentation and the annotation, in yellow. The five rows represent, from top to bottom, a cross section parallel to the sagittal plane centred to the mandibular foramen and the mental foramen, a cross section parallel to the coronal plane and to the axial plane, and a maximum intensity projection (MIP) of the lower region of the head.

