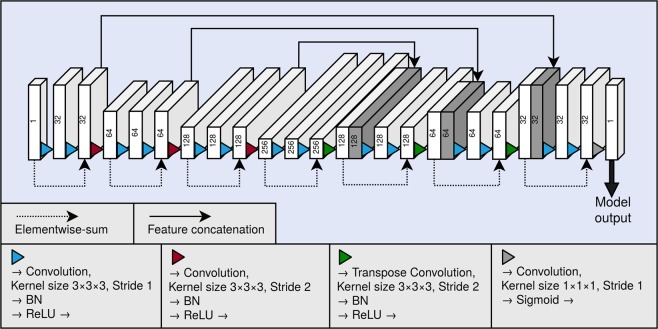
Figure 4.
Graphical illustration of our fully convolutional neural network architecture. Each block depicts a hidden layer of the network. The height of each of the blocks visualises the evolution of the spatial size in the network. As a comparison, the depth visualises the evolution of the number of the feature maps in the network. The number of the feature maps of each layer is also shown as a number on each block. The blocks containing concatenation are shown in dark grey. BN and ReLU correspond to the batch normalisation operation and the rectified linear unit non-linearity, respectively.

