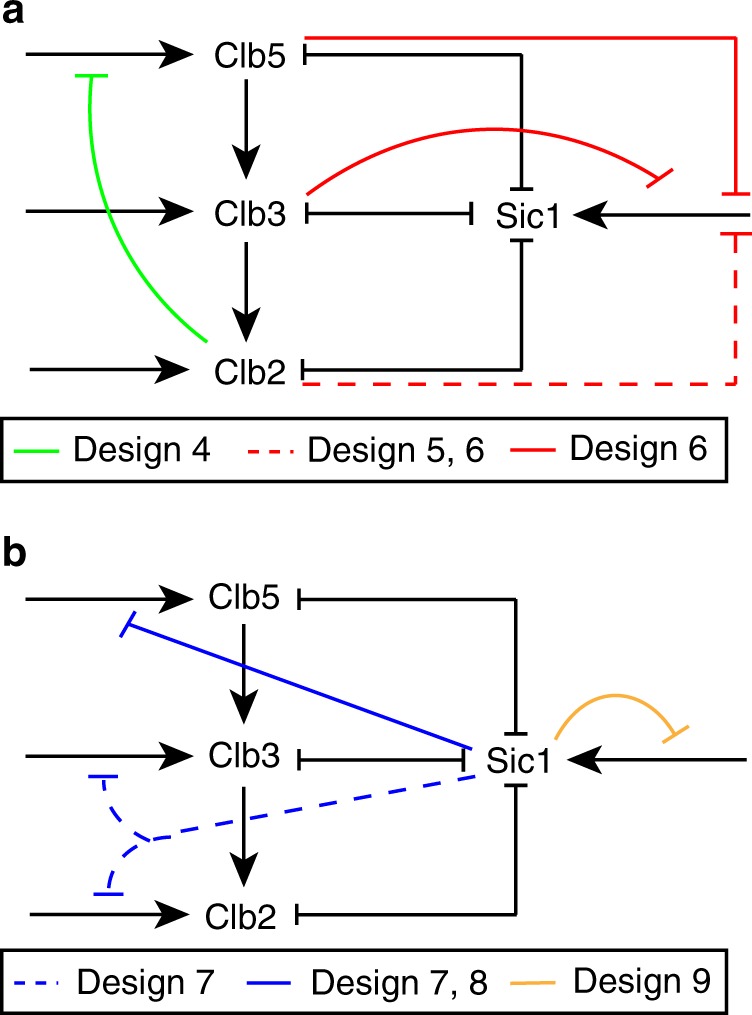
Fig. 3. Schematic view of known and hypothetical inhibitory regulations added to Design 3 of the minimal cell cycle model.

a Design 4, Design 5, and Design 6 describe known inhibitory regulations mediated by Clb/Cdk1 activities. b Design 7, Design 8, and Design 9 describe hypothetical inhibitory regulations mediated by Sic1. Colored lines indicate new regulations, with each color identifying a particular network design. Dashed lines indicate regulations occurring in two different designs. In the latter, the two designs related to each such interaction are shown with the same color. Black lines indicate the activatory and inhibitory regulations occurring in the minimal cell cycle model. See text and Supplementary Information, Section 3 for details about the specific molecular mechanisms.
