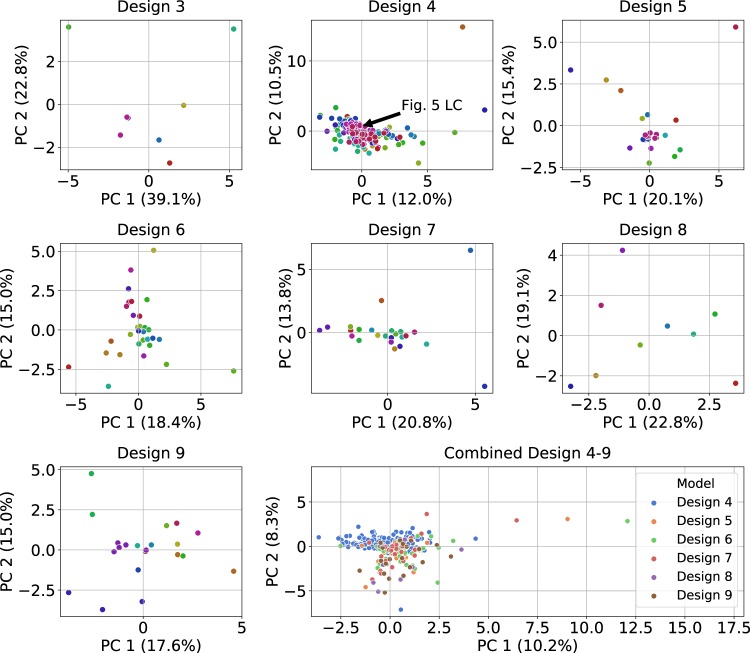
Fig. 4. Projection of limit cycle parameter sets onto the first two principal component axes, for designs 3–9 separated and for designs 4–9 combined (bottom-right).
Each dot represents a parameter set yielding a limit cycle. Parameter values were normalized to have a mean of zero and a standard deviation of 1 prior to principal component calculations, in order to deal with parameters spanning different orders of magnitudes. For the single panels, the colors indicate the unique phenotype each parameter sets belongs to. For the combined panel, the colors indicate the model design. For the purposes of this analysis, the unique inhibitory parameters in designs 4–9 were treated as the same parameter. The percentage of variance in the data explained by each principal component is listed on the axes. Values along the axes should be compared to the [0, 1] unit interval since the principal components have a length of 1 and are linear combinations of the normalized parameters.

