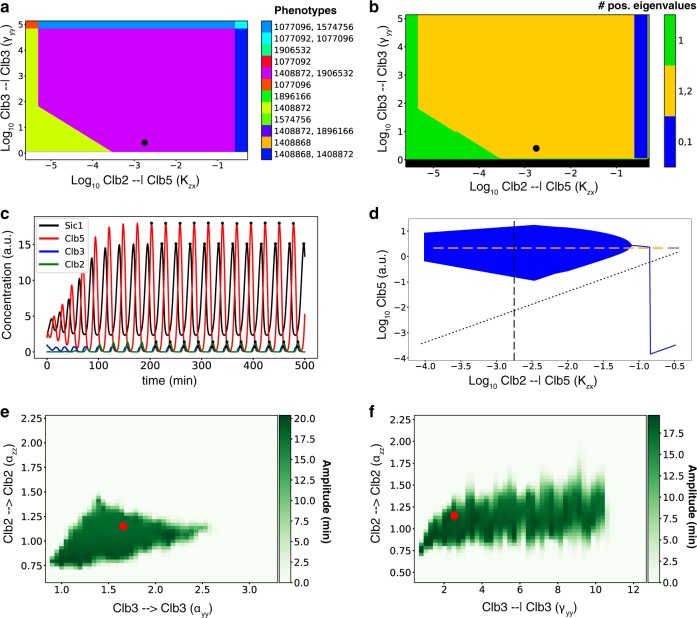
Fig. 5. Robustness of a limit cycle for phenotype number 1906532 in Design 4.
Black dot in a and b, time course in c, dotted line in d, and red dot in e and f represent the same limit cycle and parameter set. a 2D slice Kzx–γyy of the design space visualized in regions corresponding to different phenotypes. White color represents absence of phenotypes, whereas other colors indicate specific phenotypes, or combinations of overlapping phenotypes. Some regions relate to multiple phenotypes, indicating that these phenotypes overlap in this 2D projection of the parameter space. b The same 2D phase plane as in a, visualizing the number of positive eigenvalues in the steady-state of the phenotype. Black color represents absence of phenotypes, whereas the orange area supports oscillatory behavior. c Sustained oscillation time course of the limit cycle. d 1D bifurcation diagram plotting the oscillation amplitude (minimum and maximum of the oscillation) in the full model of the limit cycle for Clb5 (x on the y-axis and in the equations) while varying the Kzx parameter. Blue line represents the range of Kzx values yielding stable steady-state behavior, i.e. no oscillations, whereas the blue area represents parameters values yielding oscillations, while keeping fixed all other parameter values. Yellow dashed line indicates an unstable steady-state with two non-negative eigenvalues in the phenotype. Gray dotted line indicates an unstable steady-state in the phenotype that has one non-negative eigenvalue. Solid gray line indicates a stable steady-state; as there is more than one line, multi-stability occurs. e 2D robustness region heatmap of the amplitude of oscillations (0 and white in case of a steady-state) within a 2D slice of the parameter space. 1,000 random log-uniform samples of the parameters αyy and αzz were retrieved while keeping all other model parameters fixed. For each sample, the amplitude of oscillations in Clb5 is represented by the scale of green color. The radial basis interpolation algorithm (RBF) has been applied to infer the color for points in the plot that were not explicitly sampled. f Similar 2D robustness region heatmap as in e for αzz and γyy.

