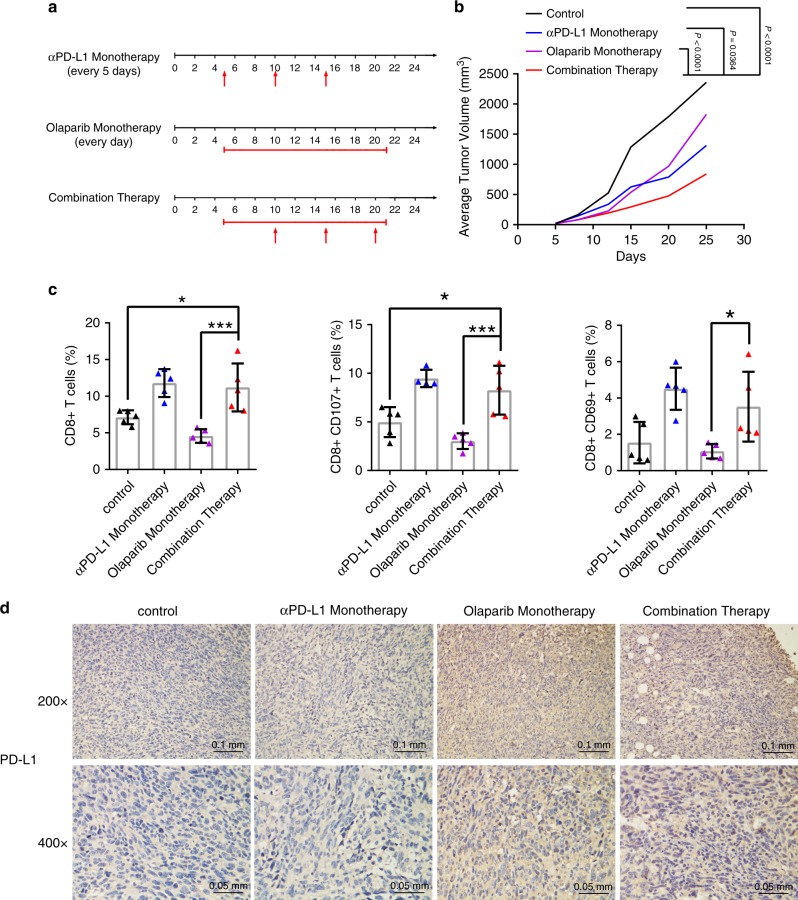
Fig. 7. Olaparib and anti-PD-L1 combination therapy was superior to monotherapy in vivo.
a Schematic diagram of dosage regimen. Control group was treated with PBS and IgG. αPD-L1 monotherapy group was treated with PBS and αPD-L1 200 μg per mouse. Olaparib monotherapy group was treated with IgG and olaparib 50 mg kg −1. Combination therapy group was treated with αPD-L1 200 μg/mouse and olaparib 50 mg kg−1. b 0.5 × 10⁶ 4T1-sh-BRCA1 cells were injected into the mammary fat pads of BALB/c mice. The average tumor volume of each group was recorded over time. c TILs in the tumors of each group (n = 5) were analyzed by flow cytometry. d PD-L1 expression was detected by IHC in mouse tumor tissues of each group. Data were presented as mean ± s.d. of three independent experiments. b, c were analyzed by one-way ANOVA + two-side Tukey test. *P < 0.05, ***P < 0.001. Source data are provided as a Source Data file.

