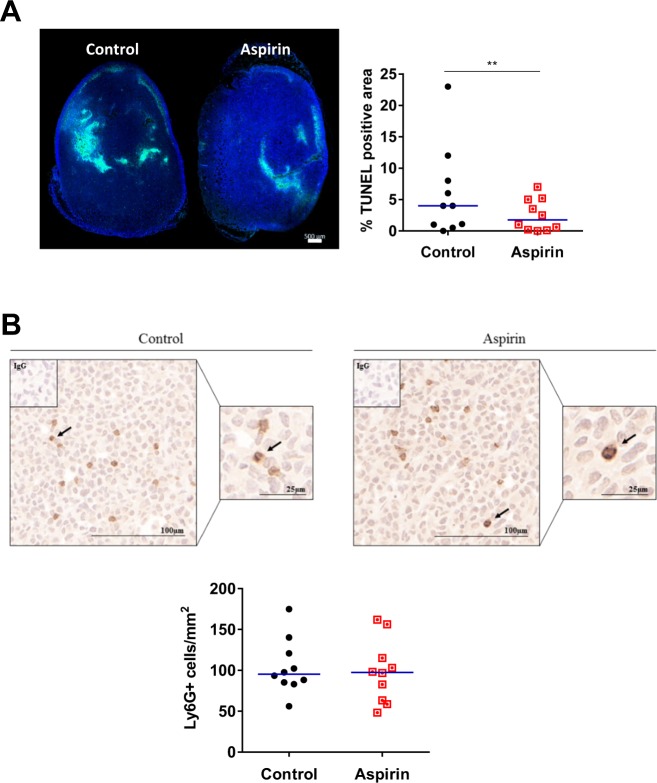
Figure 8.
Analysis of tumour necrosis and neutrophil content in control versus aspirin-treated mice. (A) Representative images of TUNEL staining from tumours harvested from control and aspirin-treated mice. DAPI (blue) fluorescence detects nuclei and FITC (green) fluorescence indicates DNA fragmentation in cells. Scale bar is 500 μm. TUNEL positivity quantified as a percentage of total tumour area. Blue lines in graph represent the medians of n = 10 tumours per group. **p < 0.01, Mann-Whitney U test. In (B), representative images of Ly6G stained MDA-MB-231-LM2 xenograft tumours harvested from mice treated without and with aspirin. Black arrows indicate Ly6G+ neutrophils. Scale bars are 100 µm and 25 µm. Neutrophils quantified per whole tumour. Blue lines in graph represent the medians. Mann-Whitney U test.

