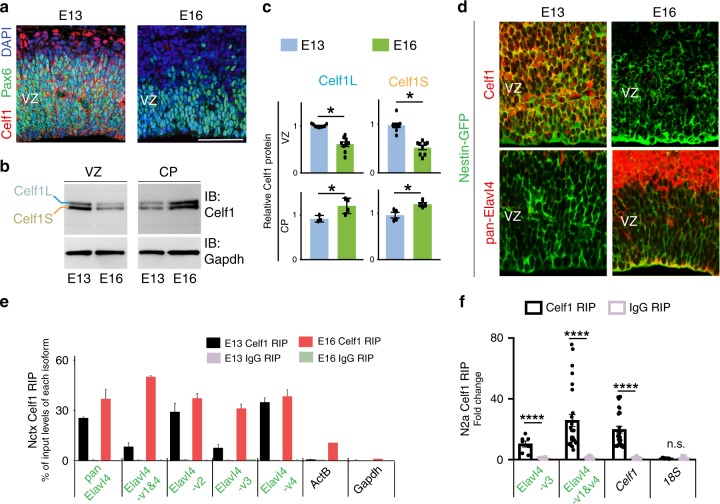
Fig. 3. Celf1 binds Elavl4 developing neocortices.
a Celf1 (red) and Pax6 (green) VZ, IHC at E13 and E16 (n = 3 animals per age). DAPI shown in blue. b Western blot of Celf1 protein (upper panel) expression in VZ and CP from LCM neocortices at E13 and E16 (n = 3 animals per age). The Celf1 upper band is putatively Celf1 Long (Celf1L); the Celf1 lower band is putatively Celf1 Short (Celf1S), indicated at left. Gapdh was used as a loading control (bottom panel). c Densitometry quantification of b. Data represent the mean and SEM. Data normalized to Gapdh and then to E13. Statistics: Student’s t-test. *p < 0.05. d Celf1 (red, top) or Elavl4 (red, bottom) IHC on Nestin-GFP (green) neocortices at E13 and E16 (n = 4 animals per age). e RNA immunoprecipitation (RIP) from E13 and E16 neocortices. Relative mRNA levels were determined by qRT-PCR from Celf1 vs. IgG RIPs (n = 4 separate RIPs, 6 neocortices per age). Pan-Elavl4 and specific Elavl4 isoforms are shown in addition to ActB and Gapdh as non‐binding controls. f RIP from N2a cells (n = 3 RIPs from separate transfections). Data represent the mean and SEM. Data normalized to Gapdh. Celf1 was used as positive control60. 18S was used as negative control. Statistics: Two-way ANOVA with Tukeyʼs. ****p < 0.0001.

