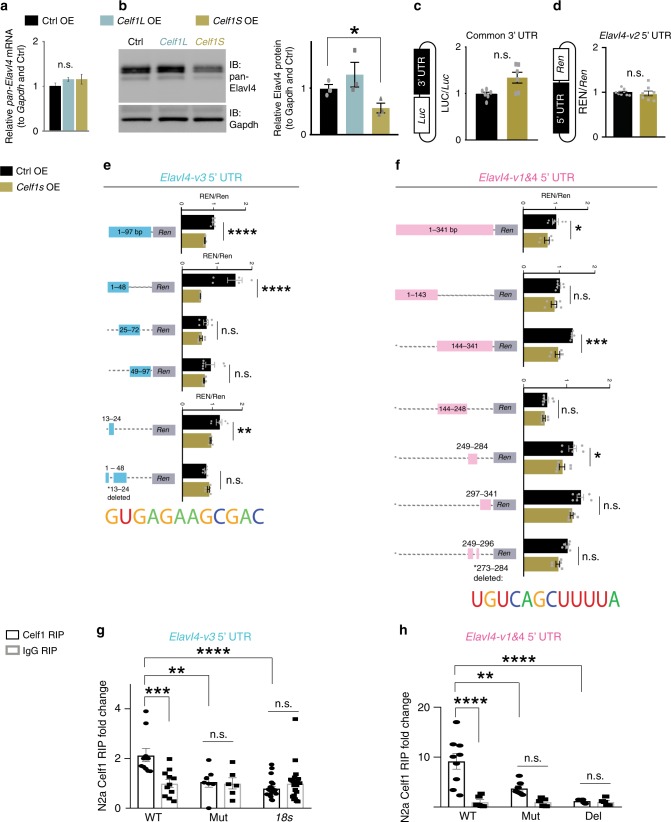
Fig. 4. Celf1S translationally repressed Elavl4-v3 and -v4 via their 5′ UTRs.
a Relative mRNA levels determined by qRT-PCR of pan-Elavl4 after either Control (Ctrl), Celf1L, or Celf1S overexpression (OE) in N2a cells (n = 6 transfections). Data represent the mean and SEM. Data normalized to Gapdh and then to Ctrl. Statistics: one-way ANOVA. n.s. = not significant. b (left) Western blot for Ctrl, Celf1L, or Celf1S OE in N2a cells (n = 6 transfections). Immunoblot of pan-Elavl4 (upper panel). Gapdh is the loading control (lower panel). (right) Densitometry quantification of Western blots. Data represent the mean, SD. Data normalized to Gapdh and then to Ctrl. Statistics: one-way ANOVA. *p < 0.05. c Schematic of 3′ UTR luciferase construct (left of bar graph). Elavl4 isoforms’ common 3′ UTR downstream of Luciferase (Luc), and cotransfected with either Ctrl OE/Celf1S into N2a cells. Translation assayed by measuring LUC RLU over Luc mRNA levels (n = 9 transfections). Data represent the mean and SEM. Statistics: Student’s t-test. n.s. = not significant. d Schematic of 5′ UTR Renilla construct (left of bar graph). N2a cells were cotransfected with Ctrl OE or Celf1S and Elavl4-v2 5′ UTR upstream of Renilla (Ren). Same assay as in c; REN measured over Ren mRNA (n = 3 transfections). Data represent the mean and SEM. Statistics: Student’s t-test. n.s. = not significant. e, f Deletion strategy of Celf1-regulatory regions in 5′ UTRs of Elavl4-v3 (e) and Elavl4-v1&4 (f). Elavl4-v3 or Elavl4-v1&4 5′ UTRs Renilla constructs; same strategy as in d. Dashed lines represent deleted regions. Numbers indicate positions in UTR, 5′ → 3′. n = 4 transfections for each experiment. bp = base pairs. Putative Celf1 regulatory sequence in Elavl4 5′ UTRs indicated under their respective bar graphs. Data represent the mean and SEM. Statistics: Student’s t-test and one-way ANOVA with Tukey’s (e, f). *p < 0.05; **p < 0.01; ***p < 0.001; ****p < 0.0001; n.s. = not significant. g, h Celf1 RIP of Elavl4-v3 (g) and Elavl4-v1&4 (h) 5′ UTRs. UTRs have WT, mutated (Mut), or deleted (Del) Celf1 binding sequences. 18s was used as negative control. Data represent the mean and SEM; normalized to Gapdh. n = 3 RIPs from 3 transfections; Statistics: Two-way ANOVA with Tukey’s. *p < 0.05, **p < 0.01, ***p < 0.001.

