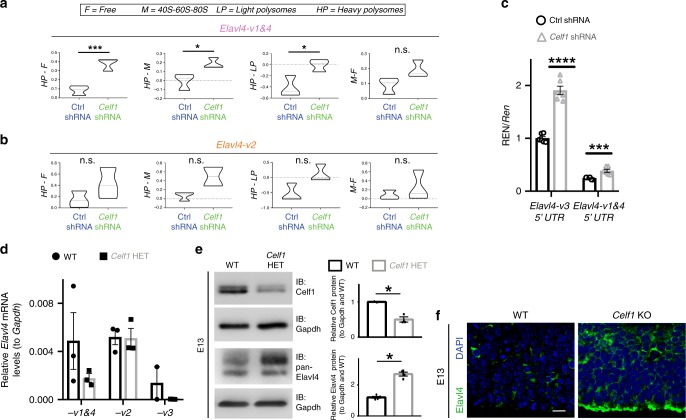
Fig. 5. Celf1 deletion derepressed Elavl4-v3 and Elavl4-v4 translation.
a, b Polysome fractionation of N2a cells transfected with either Ctrl shRNA or Celf1 shRNA. Difference between free (F), 40S-60S-80S monosome (M), light polysome (LP), and heavy polysome (HP) fractions are represented for Elavl4-v1&4 (a) and Elavl4-v2 (b). This graph plots mean difference for each condition; a higher mean difference means a greater abundance in the minuend (n = 3 fractionations, each fractionation was from one 10 cm plate transfection). Statistics: Welch’s t-test. ***p < 0.001. *p < 0.05, n.s. = not significant. c, N2a cells cotransfected with Ctrl shRNA or Celf1 shRNA plasmids and Elavl4-v3 or Elavl4-v1&4-5′ UTRs cloned upstream of Renilla. Same assay as in Fig. 4. Multiple T-tests. *p < 0.05, ***p < 0.001. d qRT-PCR determined levels of different Elavl4 isoforms in E13 WT and Celf1 HET neocortices. Data represent the mean and SEM. N = 3 separate spins with 6 brains per spin. Data normalized to Gapdh. e (left) Western blot for WT and Celf1 HET neocortices at E13 (n = 9 neocortices). (right) Densitometry quantification of Western blots. Data represent the mean and SD. Data normalized to Gapdh and then to WT. Statistics: Student’s t-test. *p < 0.05. f Neocortical VZ at E13 of WT (n = 6 animals) and Celf1 KO (n = 2 animals). IHC for pan-Elavl4 (green). DAPI shown in blue. Scale bar: 40 μm.

