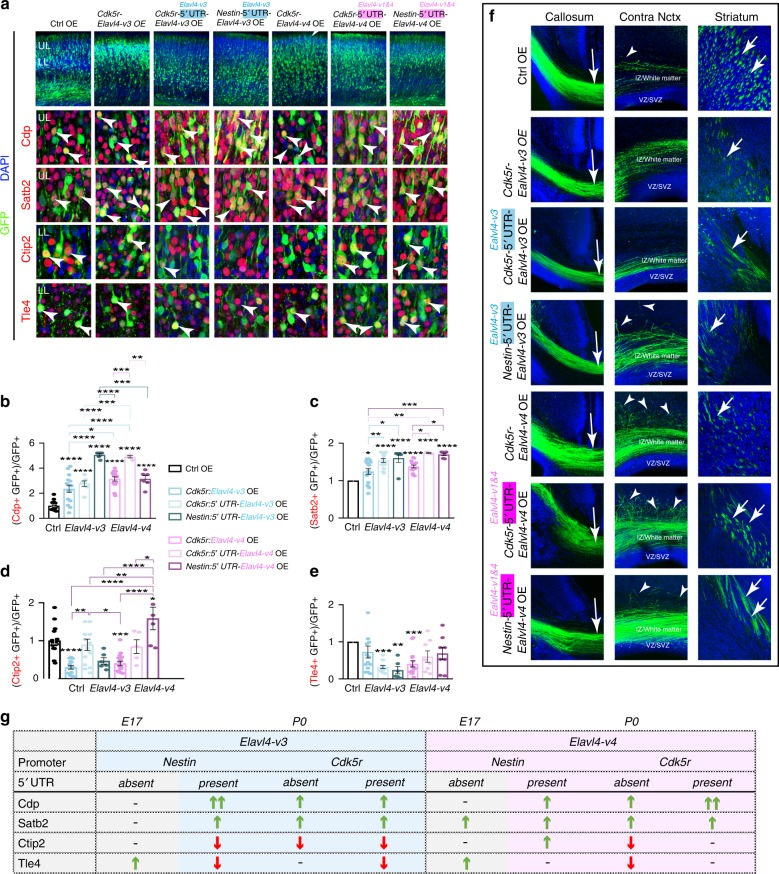
Fig. 7. Native 5′ UTRs of Elavl4 isoforms dictate neocortical glutamatergic identities.
a (top) P0 representative confocal images of E13 IUE neocortices electroporated with CAG-GFP and either Ctrl (n = 6 animals), Cdk5r:Elavl4-v3 (n = 5 animals), Cdk5r:5′ UTR-Elavl4-v3 (n = 4 animals), Nestin:5′ UTR-Elavl4-v3 (n = 3 animals), Cdk5r:Elavl4-v4 (n = 6 animals), Cdk5r:5′ UTR-Elavl4-v4 (n = 3 animals), Nestin:5′ UTR-Elavl4-v4 (n = 3 animals) OE plasmids. IHC for GFP (green), and cortical layer identity markers Cdp, Satb2, Ctip2, or Tle4 (all red). Scale bar: 20 μm. DAPI shown in blue. b–e Quantification of colocalization between layer markers (arrowheads in A) and GFP normalized to controls. Data represent the mean of sections and SEM. Statistics: one-way ANOVA with a post-hoc Tukeyʼs. *p < 0.05, **p < 0.01, ***p < 0.001, ****p < 0.0001. All significance stars that are located directly above bars are in reference to the Ctrl, otherwise indicated with line above. f P0 representative confocal images of E13 IUE neocortices electroporated with GFP and either Ctrl (n = 6 animals), Cdk5r:Elavl4-v3 (n = 5 animals), Cdk5r:5′ UTR-Elavl4-v3 (n = 4 animals), Nestin:5′ UTR-Elavl4-v3 (n = 3 animals),Cdk5r:Elavl4-v4 (n = 6 animals), Cdk5r:5′ UTR-Elavl4-v4 (n = 3 animals), Nestin:5′ UTR-Elavl4-v4 (n = 3 animals) OE plasmids IHC for GFP (green). Arrows indicate GFP+ axons passing through corpus callosum and striatum ipsilateral to IUE site. Arrowheads indicate GFP+ axons growing into neocortex contralateral to IUE site. DAPI shown in blue. Scale bar: 200 μm. g Summary table of results in Fig. 6 (E17; gray) and 7a-7e (P0; colored). Increased colocalization is indicated with a green up arrow and decreased colocalization is indicated with a red down arrow.

