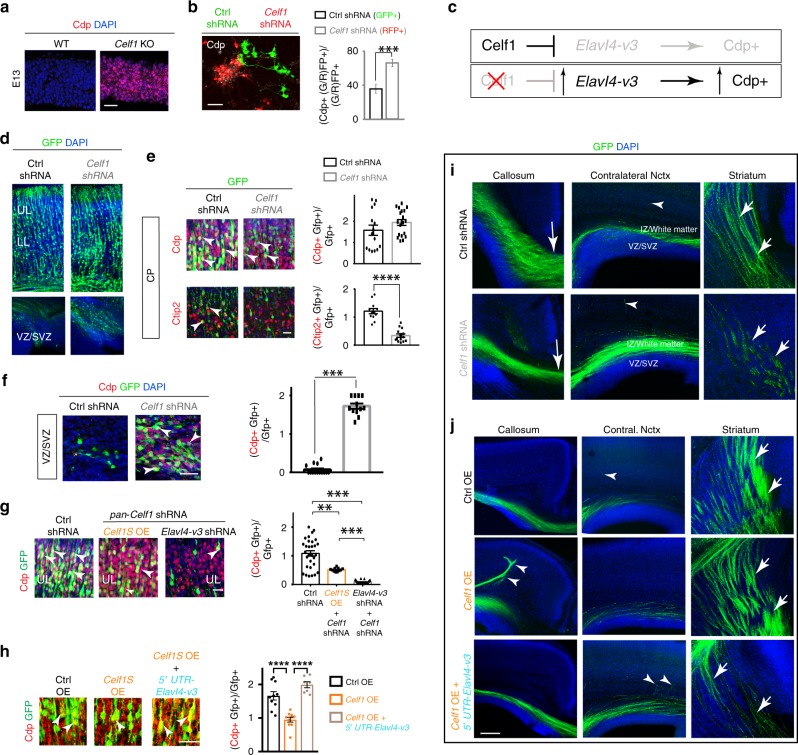
Fig. 8. Celf1 regulates development of glutamatergic neurons in developing neocortices through Elavl4.
a Neocortical E13 VZ of WT (n = 6 animals) and Celf1 KO (n = 2 animals). IHC for Cdp (red). DAPI shown in blue. Scale bar: 100 μm. b (left) Representative IHC of three days in vitro primary neocortical neuronal cultures. Transfected neurons are expressing GFP (Ctrl shRNA) or RFP (Celf1 shRNA) and neuronal identity marker Cdp (white). Scale bar: 40 μm. (right) Quantification of Cdp colocalization. Data represent the mean and SEM. N = 1 litter (14 embryos). Statistics: Students t-test. ***p < 0.001. c Schematic: Celf1 translationally represses Elavl4-v3, which decreases Cdp+ identities. Once Celf1 is silenced, Elavl4-v3 translation is derepressed, increasing Cdp+ identities. d P0 representative confocal images of E13 IUE neocortices electroporated with CAG-GFP and either Ctrl shRNA (n = 5 animals) or Celf1 shRNA (n = 4 animals) at E13. Ventricular zone/subventricular zone (VZ/SVZ) shown underneath. GFP is green. DAPI shown in blue. Scale bar: 100 μm. UL = upper layers, LL = lower layers. e (left) P0 representative confocal images of transfected neocortices in d, immunostained for cortical neuronal identity markers Cdp and Ctip2 in CP. Arrowheads indicate colocalization. Scale bar: 40 μm. (right) Quantification of Cdp and Ctip2 colocalization. Data represent the mean and SEM. Statistics: Student’s t-test. ***p < 0.001. f (left) Representative confocal images of transfected neocortices in e, immunostained for cortical neuronal identity marker Cdp in VZ/SVZ. Arrowheads indicate colocalization. Scale bar: 40 μm. (right) Quantification of Cdp colocalization. Data represent the mean of sections and SEM. Statistics: Student’s t-test. ***p < 0.001. g (left) P0 representative confocal images of E13 IUE neocortices electroporated with CAG-GFP and either Ctrl shRNA (n = 5 animals), Celf1 shRNA and Celf1 OE (n = 3 animals), or Celf1 shRNA and Elavl4-v3 shRNA (n = 3 animals). IHC for GFP (green) and layer marker Cdp (red). Arrowheads indicate colocalization. Scale bar: 40 μm. UL = upper layer. (right) Quantification of Cdp colocalization. Data represent the mean of sections and SEM. Statistics: one-way ANOVA with Tukeyʼs. *p < 0.05, ***p < 0.001, n.s. = not significant. h (left) P0 representative confocal images of E13 IUE neocortices electroporated with GFP and either Ctrl (n = 4 animals), Celf1 OE (n = 3 animals), or Celf1 OE and 5′ UTR-Elavl4-v3 (n = 3 animals) OE plasmids IHC for GFP (green), and cortical layer identity markers Cdp (red). Arrowheads indicate colocalization. DAPI shown in blue. Scale bar: 40 μm. (right) Quantification of Cdp colocalization. Data represent the mean and SEM. Statistics: one-way ANOVA with Tukeyʼs. ***p < 0.001. i, j Representative confocal images of the corpus callosum, contralateral neocortex, and striatum of P0 neocortices that underwent IUE with GFP and either Ctrl shRNA (n = 5 animals) or Celf1 shRNA (n = 4 animals) (i) or either Ctrl OE (n = 3 animals), Celf1 OE (n = 3 animals), or Celf1 OE and 5′ UTR-Elavl4-v3 (j). Scale bar is 200 μm.

