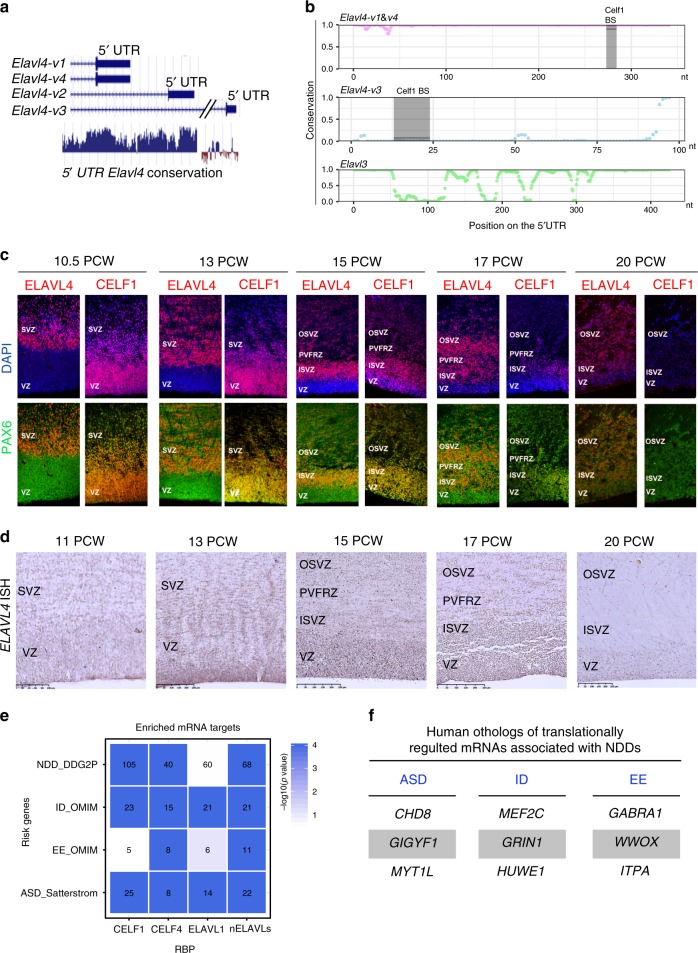
Fig. 9. ELAVL4 and CELF1 have opposing expression in developing human neocortical VZ.
a Alignment of mouse Elavl4 5ʼ UTRs (top). Conservation of UTRs shown below. b The plot shows the probability (y-axis) that each nucleotide in the 5ʼ UTR (x-axis) belongs to a conserved element for Elavl4-v1/4 (pink), Elavl4-v3 (light blue) and Elavl3 (green). Each dot represents a base pair. Celf1 regulatory binding sites (BS)-are indicated by the black bar/shaded area. nt, nucleotide. c Representative confocal images of human ventricular zone (VZ), inner subventricular zone (ISVZ), periventricular fiber rich zone (PVFRZ), and outer subventricular zone (OSVZ) at 10.5, 13, 15, 17, and 20 PCW in the frontal lobe. IHC for PAX6 (green) and either CELF1 (red) or ELAVL4 (red), indicated above image. DAPI shown in blue. d Representative images of in situ hybridization (ISH) for Elavl4 on human VZ, ISVZ, PVFRZ, OSVZ at 11, 13, 15, 17, and 20 PCW in the frontal lobe. Scale bar: 100 μm. e The heatmap shows the degree of enrichment for mRNA targets of neuronal ELAVLs (nELAVLs), ELAVL1, CELF1 and CELF4 across neurodevelopmental disorders genes defined by the Developmental Disorders Genotype-Phenotype Database (NDD_ DDG2P), epileptic encephalopathy genes in OMIM (EE_OMIM), intellectual disability genes in OMIM (ID_OMIM) and ASD risk genes (PMID: 31981491). Color coding indicates –log10(p-value) after 10,000 permutations. Number of overlapping genes is indicated in each cell. f Examples of top translationally regulated genes implicated with ASD, ID, and EE. Note that some of these genes can manifest with co-morbidities.

