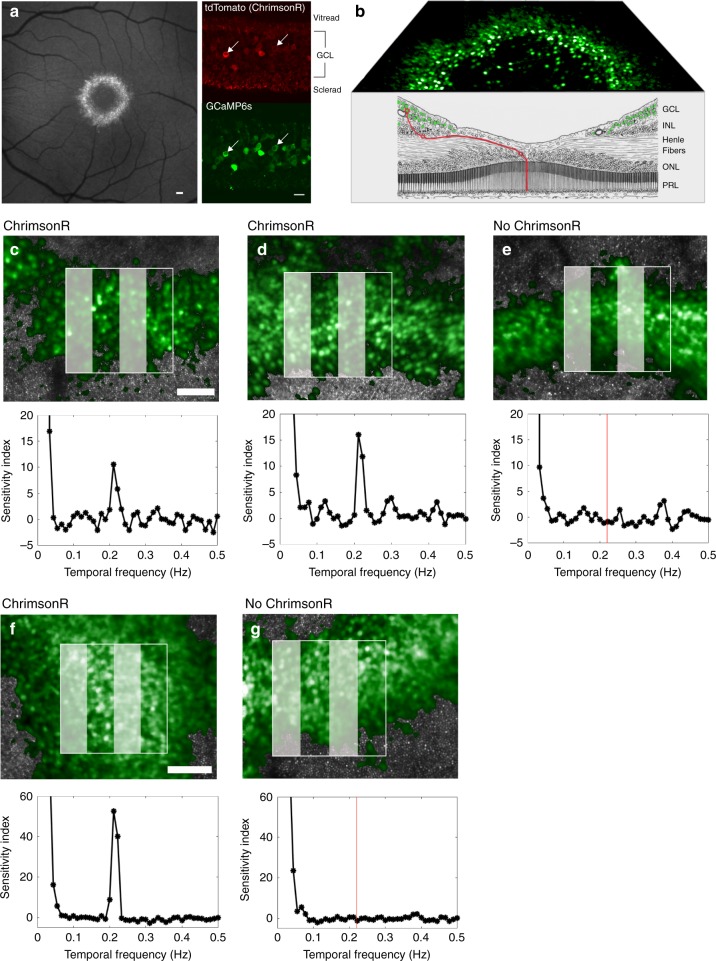
Fig. 1. GCaMP6s recording from foveal retinal ganglion cells in the living macaque shows ChrimsonR mediated responses to a drifting grating stimulus.
a (Left panel) Scanning light ophthalmoscope image of GCaMP6s expression in the ring of ganglion cells serving the foveal cones, scale bar 150μm. (Right panel) Confocal microscope images of GCaMP6s and ChrimsonR co-expression, scale bar 20μm. b Schematic diagram of the fovea, (modified from Polyak, 1941)24 showing fluorescent foveal retinal ganglion cells (green) laterally displaced from their photoreceptor receptive fields (red line). c (Upper panel) Adaptive optics scanning light ophthalmoscope image of the stimulated region of retina from which the data shown in the lower panel is derived. Scale bar 100 μm. Fluorescent retinal ganglion cells shown in green, photoreceptor mosaic in gray. (Lower panel) Mean response of 48 cells to 0.2 Hz patterned stimulus in the left eye of animal 2, 5 months after intravitreal injection of ChrimsonR and GCaMP6s. d Mean response of 38 cells to 0.2 Hz patterned stimulus in the right eye of animal 2, 10 months after intravitreal injection of ChrimsonR and GCaMP6s. e There is no response in the left eye (38 cells) of the control GCaMP6s-only animal (animal 3) at 0.2 Hz (red line) 5 months after intravitreal injection of GCaMP6s. f Mean response of 65 cells to 0.2 Hz patterned stimulus in the left eye of animal 4, 7 weeks after intravitreal injection. g No response in the right eye of animal 4 (49 cells) at 0.2 Hz (red line) that has received GCaMP6s only, 9 weeks after intravitreal injection. Representative results are shown. Data was taken with similar results in more than 20 separate imaging sessions for the treated animals and across 6 imaging sessions for the control animals. Source data are provided as a Source Data file.

