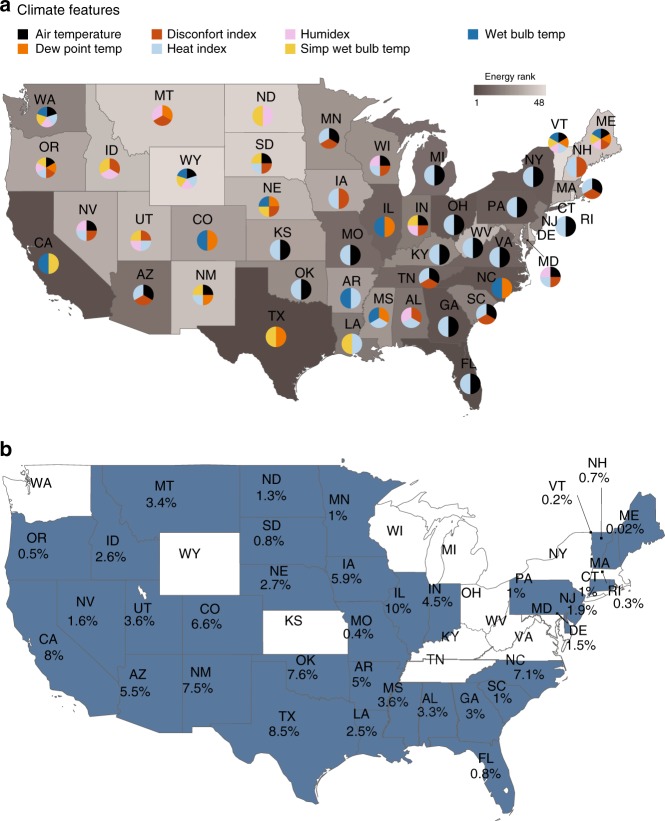
Fig. 1. Key climate predictors of cooling demand.
a States are shaded according to total energy consumption intensity (scale bar goes from 1 to 48, with darker tones representing higher intensity states in terms of energy consumption). The pie charts illustrate the state-level key measures of heat stress for predicting the climate-sensitive portion of electricity demand. The majority of states have up to two most important features. It is important to point out that climate sensitivity is not an exclusively geographical characteristic, and considering the population density weight method for the variables calculation (see Methods), it is possible to expect neighboring states to not necessarily have the same selected climate variables. Non-summer-peaking states with many selected features (e.g., Washington (WA) and Oregon (OR)) reveal relative climate insensitivity in comparison (Supplementary Note 1). Note that the top energy-consuming states of California (CA) and Texas (TX) do not include air temperature as the key predictors of the climate-sensitive portion of demand. b Highlighted states show percentage improvement in predictive accuracy when comparing the selected-features models to the air-temperature-only models (comparison based on out-of-sample RMSE). Source data are provided as a Source Data file.

